The other day I was talking to an acquaintance who was looking at building a portfolio of stocks. Nothing wrong perse but he neither had interest in understanding the markets nor had the time to devote to the subject (there is a reason all the big investors have been full time investors from long time). I explained that I felt that the best investment for him would be Index funds.
Index funds are unloved. My suggestion more or less ended the conversation. I was reminded of this conversation thanks to this tweet
Rich in itself has no definition. Is someone with a crore of rupees rich or someone with a hundred crore of rupees rich? Morningstar says someone with 5 Crores in Investment can be defined as rich in India. On the other hand, if you have wealth greater than 65 Lakhs, you are in the top 10% of Indians and that definitely counts for something.
I myself wrote something on this subject
Getting Rich vs Getting Wealthy – March 2022 Newsletter | Portfolio Yoga
On Twitter, much of the talk (outside of making billions in options trading) revolves around individual stocks. This is because of the fact that unlike funds (which are a portfolio of stocks), a single stock can go up 1000% in a year or less (on the NSE over the last one year, M K Proteins, a SME has shot up by 1500%+) and these kinds of moves provide opportunities for showcasing the greatness of the investor in having been able to identity such a stock.
It’s another matter that very few actually would have invested anything substantial (as % of their net worth) but it’s not money made that is the criteria.
When a new investor looks at tweets and especially by those who have a huge following (numbers boosted mostly as a result of seeming to be invested in every moving stock out there), the assumption is that investing is easy and a portfolio of such stocks should easily beat the measly returns of the Index.
Majority of Mutual Funds and PMS don’t beat the measly Index returns and even those that beat don’t beat them consistently. This despite having a deep research team on which hundreds of crores are spent annually. Yet, the fact that even with low odds, there is always a possibility of beating the markets and this attracts investors like an ant to honey.
While I have not come across any study (pretty sure one would be there somewhere), my assumption is that the majority of investors lose money, let alone beat Nifty returns. This is due to the fact that very few stocks actually create wealth in the long term.
A paper by Hendrik Bessembinder showcased that in the US, the best-performing four percent of listed companies explain the net gain for the entire U.S. stock market since 1926.
One of the surprising trends that I observe in the Indian markets is the persistent decline in the Advances-Decline Ratio.
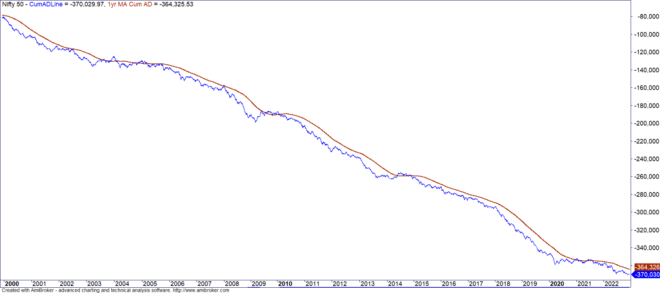
While I have no exact reason to offer for the decline even as the markets themselves have delivered big time, I wonder if the reason for this is because of the fact that Indian markets have way more small companies than large.
Just 17% of listed companies in India had market capitalization greater than 2500 Crores. Small companies, while attractive to investors for the chance to get onto the train before the long journey starts, have a very high failure rate. The attraction towards these smallcaps though is massive like in a lottery, there will always be a few winners and stories of how someone made it rich keep others in the fray.
Since 2005 to date, Nifty has closed in the positive zone 54% of the days. On the other hand, breadth has been positive (more advances than declines) just 46% of the time.
Outperformance of stocks vs Nifty is lumpy. Here for example is a chart showcasing the percentage of stocks whose 3 year (rolling) returns were greater than Nifty. Do note the date on the X-axis is the end date.
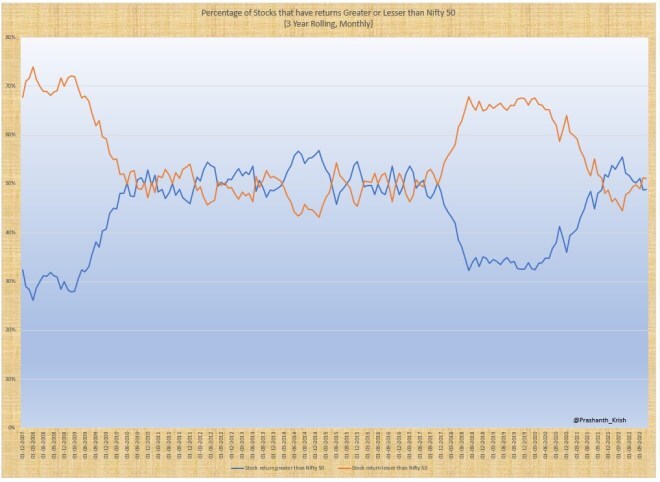
But the above chart has an issue. Dead stocks get eliminated (once they stop trading). For example, if in a single month 100 stocks which were underperforming stop trading, the next data point with all things being the same would show a higher percentage of stocks as beating Nifty.
A better way would be to maybe look at the CAGR outperformance vs Nifty of each stock since their listing (or the first available trading date, whichever is later). Stocks with data less than one year have been ignored.
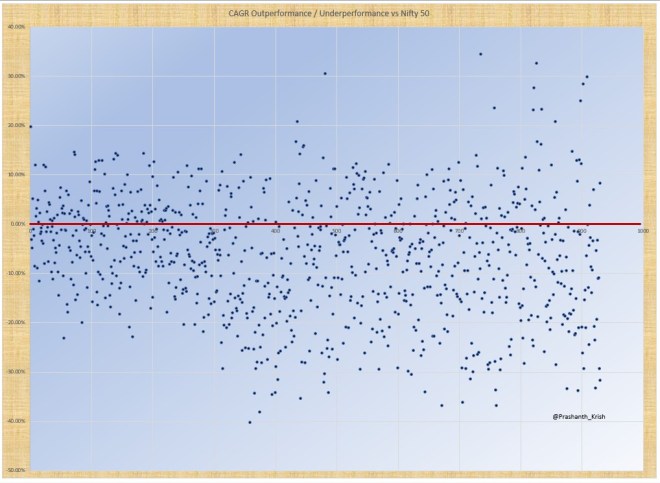
The scatterplot above plots stocks with the longest period of being listed to the least (0 to 1000 on the X Axis).
Nearly 70% of stocks have not been able to beat Nifty returns (Dividends not included). The Median outperformance of the stocks that did beat Nifty came at 9% while the Median of those that underperformed was at 16%
Here is how the distribution shows up
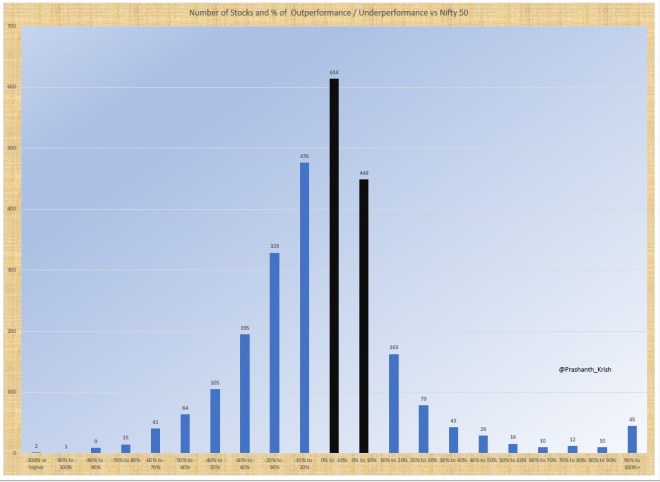
Before you get too excited about the 45 Stocks that are at the right end of the tail, few of them are delisted and of the 26 still listed, save for Adani Green and Adani Total Gas, rest of the stocks were listed March 2020 or later. Equippp Social Impact Technologies Ltd which listed on 20th May 2021 at 1.45 and today even after a 78% drawdown from the peak has outperformed Nifty by 737% and is the biggest gainer.
74 Stocks have data from November 1994 and continue to be listed today. 46 of them have underperformed Nifty while 28 have outperformed the Index (biggest outperformer benign Infosys).
Another way to break down this data is to look at the stocks by year of listing. Save for 2019 and 2020, in no year has there been more stocks that outperformed the Index.
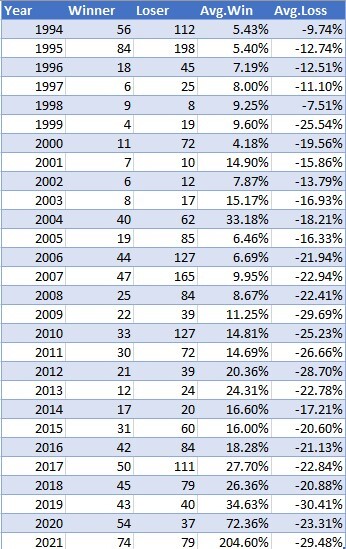
Stock picking is ridiculously difficult and yet social media and business channels make it seem like a cakewalk. Very few succeed to beat the Nifty in the long term but the fascination to make the cut remains.
Beating Nifty in itself doesn’t have to be the criteria to judge but if one is not fascinated by the process of investing, one should question the merit of trying to pick stocks in the hope that one will strike lucky and become incredibly rich.
In many ways, this study can be seen as biased in favor of investing for the odds of long term success appears unusually high. I assume one reason for that is that it’s only now that Institutional money is starting to dominate. At the beginning of this Century, Retail Ownership of listed companies (NSE listed) was to the tune of 18% and one which stands today at less than 10%.
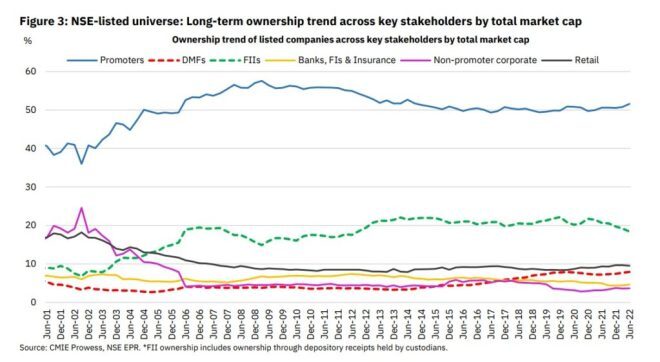
Going further, I sense that this will only go down as equity participation via vehicles such as Mutual Funds and PMS increase over time. Ownership by portfolio management companies today is not classified separately since it’s held by the clients directly in their own accounts. This in a way means that even that 10% may be wrong and the real number much lower.
I wish there was a way to calculate how much of the wealth that is being created was getting spread between the various participants. While Mutual funds are panned for not beating the Index, they have (at least based on the data I have) not lost money (when markets themselves have been up big time). Same I doubt can be said for retail investors.
When Warren Buffett started his career, there was very less competition to speak about. Every “Next Warren Buffett” has got blown over today because the risks required to be taken to become the next Warren Buffett have become incredibly high and that risk generally tends to mean that the chances of blowing up is higher.
In Lewis Carroll’s Through the Looking-Glass the Red Queen famously states to Alice ‘it takes all the running you can do, to keep in the same place. For the retail investor, the overall drift appears to go against him. To just ensure capital is not lost requires a lot of work. The question given that time is limited, is that effort worth it?

MUTUAL FUND IS AN INVESTMENT OPTION , THAT CREATES DISCIPLINE TO INVEST REGULARLY VIA SIP MODE
THE POINT IS TO BEAT FIXED INCOME WITH NO WORRIES
INVESTORS INVEST WITH DISCIPLINE AND CREATE WEALTH UNDOUBTEDLY