Notice: Function _load_textdomain_just_in_time was called incorrectly. Translation loading for the restrict-user-access domain was triggered too early. This is usually an indicator for some code in the plugin or theme running too early. Translations should be loaded at the init action or later. Please see Debugging in WordPress for more information. (This message was added in version 6.7.0.) in /home1/portfol1/public_html/wp/wp-includes/functions.php on line 6114

Deprecated: Class Jetpack_Geo_Location is deprecated since version 14.3 with no alternative available. in /home1/portfol1/public_html/wp/wp-includes/functions.php on line 6114

Deprecated: preg_split(): Passing null to parameter #3 ($limit) of type int is deprecated in /home1/portfol1/public_html/wp/wp-content/plugins/add-meta-tags/metadata/amt_basic.php on line 118
PE | Portfolio Yoga

Blood on the Streets?

Today was a record breaking day in many aspects. The opening gap down for instance, we last saw something bigger way back in 2007. The net change for the day was a 3.5 standard deviation of daily returns, something we last saw in 2008. Not a single Nifty stock ended in positive territory, not even defensive stocks which got hit (though compared to the battering many other stocks got, this was more of a slap on the wrist).

We can slice and dice data in many ways, but what it won’t tell us is whether the fall is a sign of a long term bottom being formed (panic bottoms are generally ones that aren’t easily broken) or this is just the start on what could be a long journey into the dark world of bears.

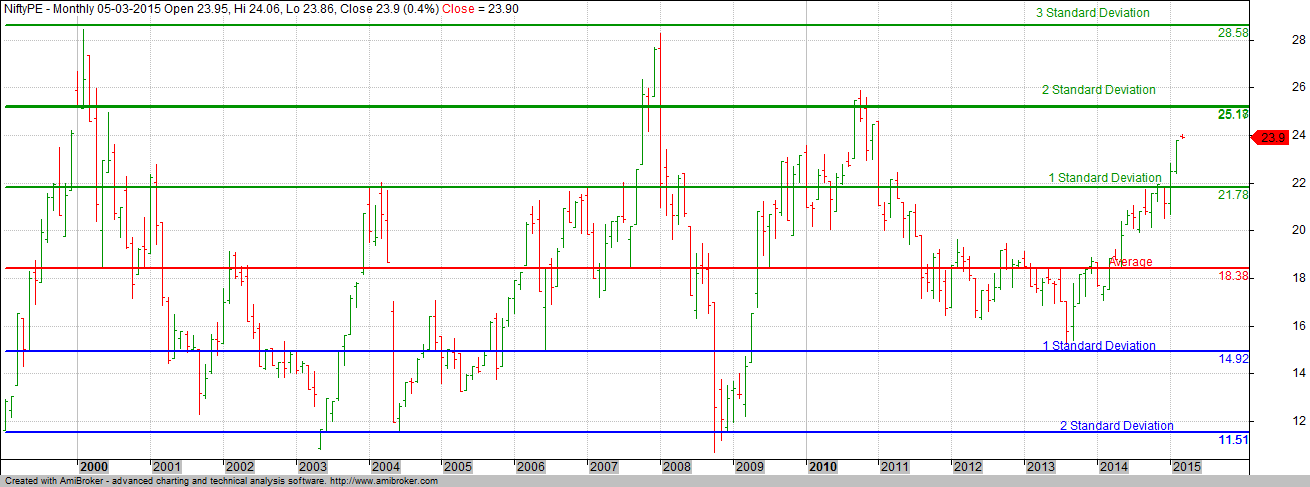
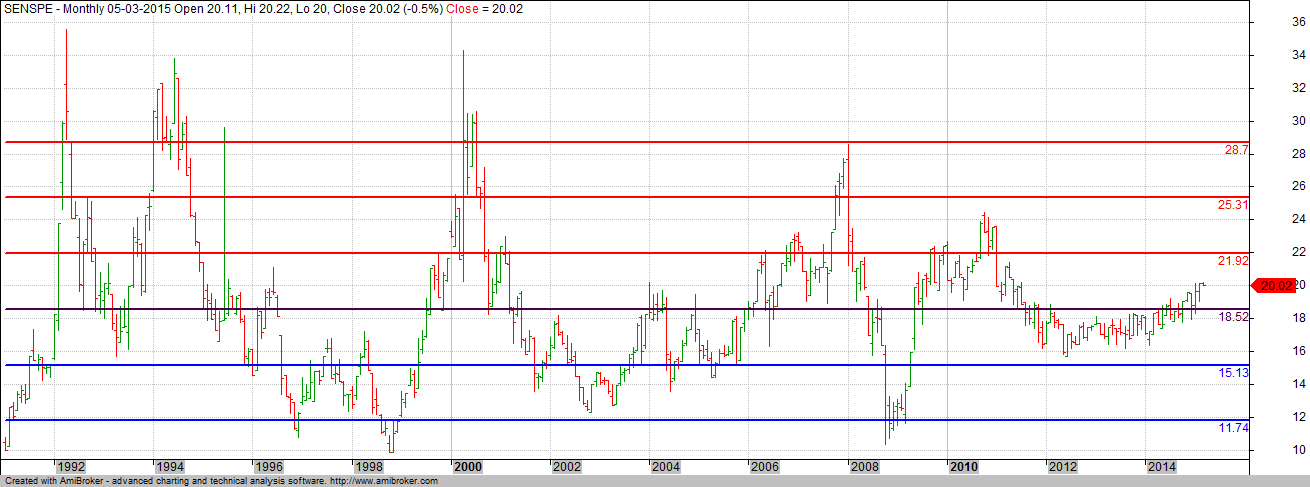
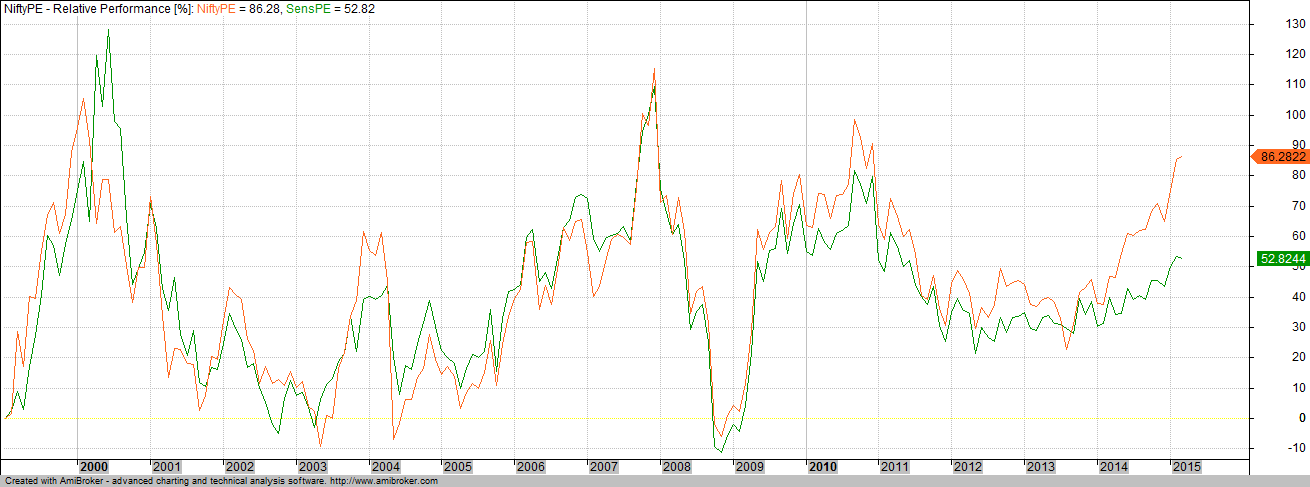
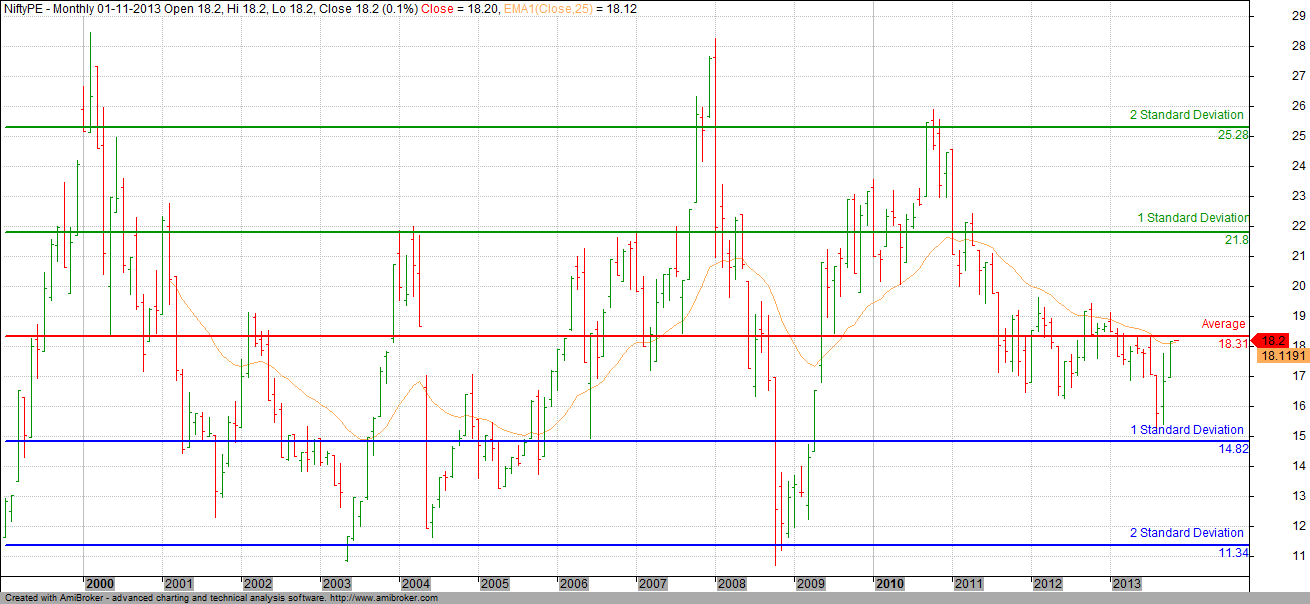
To being with, lets look at two fundamental based charts. PE charts of Nifty and CNX 500. The key reason for looking at these charts is to understand where are in relation to the past.

CNX500 NiftyPE


Lets first start off with the broader CNX 500 PE chart. While today’s fall has meant it broke down below the 2nd Standard Deviation, the fact is that even today, CNX 500 is very expensive. While there maybe pockets of value, on the whole though, market seem to be on the expensive side and since there is vast amount of evidence that buying a stock when its expensive is as bad as buying a bad stock, its tough to lay out whether we should jump in after today’s fall.

Since the PE ratio also accounts for results of the June quarter, the next trigger can only be in September if companies come up with splendid numbers. But with GDP growth slowing down, its a question as to whether companies can actually match market expectations.

On the other hand, while Nifty going by its PE is not as expensive as CNX 500, its not in the area of cheapness either and this creates a dichotomy in a way. Can mid caps correct without there being a impact on the large caps? While Nifty PE moved below the 1 Standard Deviation thanks to today’s fall, its not exactly in a area of cheapness.

After the Modi victory, markets realigned themselves with the hope that with strong growth, even if a company is over valued in today’s terms, they shall get back to normal by way of better earnings. Unfortunately, anyone who has kept a eye on earnings has been disappointed by the lack of growth in majority of companies.

In bull markets,, all kinds of reasons of why a company is not growing gets accepted without much damage to the price, but once markets starts hitting a trough, every company gets its growth put under a microscope to determine whether there is really stuff out there. We are currently at one such stage.

Today’s fall has created a lot of interest as to whether we are seeing a situation similar to what we saw in 2008. While one can only be sure in hindsight, I am pretty confident and shall stick out my neck to say that this ain’t 2008 repeat. But then again, while we remember 20058 thanks to recency bias, what worries me is whether this is a action replay of what happened in 1997 Asean Crisis.

While Indian markets were not as exposed to the world events in 1997 as it is today, by the time the bottom was made, Sensex was 31% below its 52 Week high. Even accounting for today’s fall, we are just 13.6% from our 52 Week high.

Just like in 1997 when most countries were not sure of what was happening in the Asean countries, similar is the situation today with respect to China. The opaqueness of the situation creates a scare that is larger than what may actually be the true picture.

Sensex hit a 52 week low today and while that may seem damming, its a good thing since historically, the first low after a series of highs has never continued without there being a strong bounce back to scare off even the strongest bears.

While FII’s sold heavily in the market and hence maybe in a way accelerating the decline, purely based on how the Rupee has behaved against the Dollar, I believe that India is still relatively unscathed with depreciation not amounting to much (which in other words suggests that while FII’s maybe selling, they aren’t taking out money from India).

But having said all that, I continue to believe that there is no reason to be aggressively long in this market.  My own Assset Allocation meter suggests just 55% exposure to equities. As a saying goes, while the early bird gets the worm, the second rat gets the cheese. Regardless of today’s fall, I continue to believe that Risk Reward wise, we aren’t in a stage where markets are a blind buy.

Yes, Analysts may talk about how selective stocks / sectors are performing better, but unless you believe that you can identify them in advance, the best thing to do will be stay on the sidelines with cash ready to deploy.

They say, Patience is a virtue and for a investor, its important to be aligned correctly since the short term (1 – 3 year) returns are dictated by when you enter. At today’s PE, the 1 year forward growth is still an average 5% but at 19, this moves to 11% which given the circumstances will be a very good return if that gets achieved.

The following table should provide you with perspective on what to expect (based on historical averages) if you were to buy at X times earnings on Nifty

PE

To conclude, if your allocation to equities is below 50%, now is the time to enhance upto a max of 60%. If you are already there, it could be profitable to wait for the dust to settle before diving in.


Comparing PE Ratio of Sensex & Nifty

For a long time, we looked at only one Index when it came to the Indian Markets and that was the Sensex. Even years after Nifty had come into the picture, Sensex reigned supreme. While Bombay Stock Exchange is the oldest exchange in Asia, when it came to the Sensex, the whole concept is fairly recent  having been first compiled in 1986, more than 110 years after it was founded.

But with derivative trading in Nifty taking precedence, Nifty is the key Index most participants look at. While we have seen Sensex too becoming available for trade, the first mover advantage has meant that Nifty has virtually steam rolled over it.

When it comes to analyzing how expensive or cheap the markets have been, I have most of the time stuck to Nifty since NSE has made the download free and easy. But today I decided to update my Sensex PE and the variation was very interesting to say the least.

First out, here is the updated Nifty Price Earnings (trailing 4 Quarters, Standalone) chart with long term average and standard deviations

Nifty

NSE provides data from 1999 and the calculation suggests that we are closing on to the peak valuation of 2010.

Theoretically speaking, the Sensex PE should show a similar number despite the fact that it has lower number of stocks compared to Nifty. But Sensex Price Earnings number seems to suggest that the market is not all that expensive. A caveat here, While I downloaded the Sensex Price Earnings number from its website, I could not gather as to whether the same is based on Consolidated numbers or Standalone and that in itself can make a difference.

Sensex

What is interesting is that sector weights aren’t too different from each other. Below is the sector weight charts for both Nifty and Sensex.

Nifty Sensex

As you can see, the difference in weights is not so much as to impact the net valuation on a big time.

To better understand the moves of Sensex PE Ratio and Nifty PE Ratio, here is the chart of them combined (Relative Comparison)

Nifty

One of the things that is straight away visible is that while they have more or less moved in sync in the past, this time around, Nifty PE Ratio has shot up more substantially than that of Sensex.

And here is a Relative Comparison chart of Nifty & Sensex

Nifyt

And finally, a ratio chart where I divide Sensex with CNX Nifty

Nifty

What the above chart shows is the points Sensex moves for every point on Nifty. Since 2001, this has been in a broad range.

Personally, I would stick with the NSE Price Earnings Ratio but it would be interesting to know why we are seeing this sudden difference in the Price Earnings of Sensex vs Nifty. The difference lies in a few company results, but it would be interesting to know which of them have actually caused this action.

This time its different #Nifty

After weeks of nightmares about how to fund today’s Marked to Market margin, Bears finally had something to be happy with Nifty cracking by 1.3% by end of day. While a 1% fall in markets should be common enough, it was something that was missed in the last 24 days.

In a bull market, one is told that the best way to participate would be to buy on every dip. While it makes a lot of sense in theory, the question is how to apply it practically. After all, how does one know whether we have seen that dip or not.

Unlike most pundits on Twitter and Television, I do not have a crystal ball to say where one should Buy or Sell. On the other hand, with the help of some Statistics, its possible to compare contexts with how markets have behaved historically and come to a educated guess.

Lets first start with the most basic question. Have the markets gone up too much too fast? In the last one year, markets have gone up by around 60% and considering the circumstances in which this has happened (change of government, US markets in a strong bull market, economy seeming to show signs of bottoming out among others), this is something that is acceptable. After all, markets discounts the future and markets believe the future is pretty good compared to the immediate past.

The key difference between the current bull market and the one’s we have seen previously (2000, 2003, 2009) is that those rallies were born out of pessimism. Markets had become pretty cheap (when measured via trailing Nifty PE), we started off the rallies with Nifty PE being around 10 whereas in the current instance, markets started off without being too cheap (we never dropped below 15).

Today, Nifty 4 Quarters trailing (Standalone) PE stands at 21.09 and just a few days ago tested the 1 Standard Deviation. Coincidentally, this is the same level from which markets reacted in 2003 (chart below) and while the circumstances are hugely different, some reaction from this level maybe given as per this data.

Nifty

Previous bubble burst’s have happened when Index was well over teh 2nd Standard Deviation (and pretty close to the 3rd), so in this instance, we can rule out the possibility that the current rally was a bubble and the hope that this may result in a straight line fall.

This rally has been different in a lot of ways, much of which I believe is due to the Quantitative Easing that has resulted in a flood of liquidity resulting in most markets seeing a very low historical volatility and a constant bullish undercurrent.

Take a look at the following chart for example

Nifty

The lower pane shows the number of weeks since we saw a 5% cut (on weekly). Since 2010, we have had just 1 week where markets fell by more than 5% (week ending 18th November 2011).

Now check the following chart

Nifty

Between 2003 and 2008, when Indian Markets saw their best bull markets ever, we had reactions coming in constantly. The longest period we spent without a week where we saw a 5% correction was 74 weeks (compare that to 148 weeks we are seeing currently).

As much as I believe that the future looks good, the best returns are found when we buy it cheap. The markets are not as cheap but not very expensive either which puts us in a dilemma. Take a look at the spreadsheet I had posted in July of this year

sen

As you can see, above 21, the returns over the 3 year time frame get into negative territory. Of course, this being the average, you may see a +ve returns as well, but the probability goes lower as we go higher.

Technically speaking, we have not seen a good support range appear after we broke above the previous high of 6300. Interestingly that is also a level breaking which we are sure to get into a bear market.

A 20% reaction from the current high while may not appear to be in order, we have had a draw-down of 13% (Average), something we have not seen in 2014. So, even if we were to react 10% from the high, that would mean a test of 7300 levels.

For now, fresh investing can wait till we see a moderate correction at the very least.

A easy way to make money in markets

Is making money in markets easy? Well, its both Yes and No. Yes, if you are positioned rightly, making money is as easy as pie. And No, that does not mean that money can be made without a process driven approach and definitely not by trying the luck in markets when the whole herd of sheep is headed that way.

The simplest way to build wealth is by buying when cheap and selling when expensive. Fundamental Analysts go a long way to analyze what is cheap and what is expensive and while many do get it right, its not something that can be attempted by every other investor who may neither have the time nor the expertise in reading through and understanding balance sheets, cash flows, management guidance among others.

A easier way would be to buy the broader markets when markets as a whole are cheap and selling when they start turning expensive. I have in the past written about how one can use Index PE to determine where the markets are placed at the current juncture and use that info to decide what is the ideal strategy.

So, before we go any further, lets look at the monthly chart of Nifty trailing PE (Standalone)

Nifty

As can be seen in the chart above, we are well below what can be said as over-valued though the caveat is that the price earnings is based on past earnings and if future earnings are bad, we may see the PE rise even without there being much movement in the Index.

On the other hand, we do have some cushion due to the fact that we use Standalone results to calculate the earnings instead of Standalone which is at a higher keel. But since the data we have is Standalone, we shall stick to that for the time being.

While its true that a picture can say a thousand words, I believe that its better to stick to numbers to be sure of what the chart conveys in reality.

While the above chart if of Nifty, I have used the Sensex PE to calculate returns based on where we entered. The reason for using Sensex data was that it provided me with a much larger sample size compared to Nifty.

What I have tried to do is calculate the Compounded Annual Growth Rates based on where the PE was present at that time. So, if the PE was at 20.5, its returns would be recorded in the 21 frequency (representing all data from 20 to 20.99)

Sen

As you can see , the best time to buy would be when the PE ratio is between 10 to 19 and the worst time would be when PE is above 24. Save for the two green picks at 26 PE for 7 years and 10 years, almost all of the rest is the worst returns for the period. Even the outlier is more due to happenstance than something which is worth pondering and investigating further (just for info, the sample size of PE between 25 and 26 is 2 – months of July and August 2000 being the data points). Even in that outlier, do notice that the 1 year return was a negative 33.5%, something that is not easily digestible even by die hard bulls, let alone normal investors.

As on date, Sensex PE is at 18.26 (Source: http://www.vectorgrader.com/indicators/india-sensex-price-earnings) or is at 19.2 (Source: http://www.equitymaster.com/india-markets/bse-replica.asp?order=eps%20desc) .Either way, we are at the top of the band and unless we see strong earnings growth in the coming quarter results, any strong gains from hereon will only push the PE of Sensex into area where the probability is high that returns will be below par.

While I still believe that the markets are a Buy on dips, I would wait for a larger correction to jump in (add to existing positions, that is) than jump in at the first sign of correction. 

Are the markets expensive

With Nifty rising by nearly 23% from the low registered in late August, the question on top of the mind is whether markets are way over-valued compared to historical values.

One way to measure valuation is by PE and here I have plotted the CNX Nifty PE since 2000 with Standard Deviations (1,2) on either side. As on date, we are still at average valuations suggesting that while markets are not expensive, they aren’t cheap either. 

Imageif