Notice: Function _load_textdomain_just_in_time was called incorrectly. Translation loading for the restrict-user-access domain was triggered too early. This is usually an indicator for some code in the plugin or theme running too early. Translations should be loaded at the init action or later. Please see Debugging in WordPress for more information. (This message was added in version 6.7.0.) in /home1/portfol1/public_html/wp/wp-includes/functions.php on line 6114

Deprecated: Class Jetpack_Geo_Location is deprecated since version 14.3 with no alternative available. in /home1/portfol1/public_html/wp/wp-includes/functions.php on line 6114

Deprecated: preg_split(): Passing null to parameter #3 ($limit) of type int is deprecated in /home1/portfol1/public_html/wp/wp-content/plugins/add-meta-tags/metadata/amt_basic.php on line 118
nifty | Portfolio Yoga - Part 5

Nifty 7000

If measured in terms of time taken for Nifty to climb the 1000 points from 6000, this has been the 2nd longest since Nifty started in 1996.

Image

The first 100 point move was the start of the massive bull rally we saw in 2003 – 2007. Will this be the starting point of another bull rally? Time shall tell for sure though

What happens the day after a 3% move

What a massive move it was today in the markets with Nifty gaining more than 3%, something that was last seen in September 2013. Since we started trading Nifty futures, this is the 99th occasion wherein Nifty has closed above 3% .

Its interesting to note that of the 98 occasions, the next day has seen momentum continue only on 52 occasions (i.e., 53% of the time) while on 46 occasions, we actually saw the markets reacting.

When it comes to average gains and average losses (using Geomean), the swing turns to the negative side with average loss being to the tune of 1.98% vs average gains of 1.71%.

With statistics being divided more or less equally, I believe that the better way to approach the situation would be to continue to hold on (if one is already long) to their position and exit only on a signal they can trust (or use). 

Since we shall see the final phase of elections on Monday and the results will be declared (more or less) on Friday, coming week should continue to remain volatile with both sharp rallies and falls being equally possible.


Correlation between Nifty and Sector Indices

Over the last 6 months, it has been quite evident that even as the Nifty is booming higher, not all sectors are participating with it. IT which had a real good run has been on slipping quite a bit. So, the question is, what sectors are driving the current rally. As you can see in the correlation matrix below, the best performance has come in from Services sector and the Finance Sector. While IT leads the laggards, Media sector too has not had a great run.

Image

The best way to use this sector matrix is to compare how the sectors behaved during a bull run and how they performed during a bear phase and then use the same to allocate accordingly. Lets for a start see the correlation between the same sectors and Nifty when shit hit the fan and markets slumped down during 2008

Image

The surprise for me was the low correlation of Small Cap with Nifty. This despite the fact that taken on just values, small cap fell more than what Nifty did. But as my good friend, @Jace48 tells me, its the order that is important rather than the overall change and hence the low correlation. To test this a bit further, I created a 20 day running correlation between the same (same set of dates) and the chart below points out to how the indices did not trend in a similar way.

Image 

And this is how the same sectors performed during the pull-back we saw in 2008 / 2009 (exact dates being 06/03/2009 to 06/01/2010). 

Image

And finally, lastly but not the least, Correlation during bull market – Correlation during bear market

Image

While I was working on ways to present the data I had compiled, the above presentation was based on a article I found on bespokeinvest 


Volatility, Nifty and analyzing your system

Trading strategies are like seasons. When the season is in full swing, the person who follows a strategy that correlates with it feels like a king and the guy who follows a strategy that is antithestis of the that feels like shit. Currently, its a season of Mid and Small caps. Stocks in those pockets have gained substantially, better than what the overall markets have done for themselves.

When the markets are in a range, trend followers wonder where the good old days of smooth trends on rocks went by while mean reverters seem to be like god as they sell at tops and buy at bottoms. And then the season changes and every attempt at catching the top and bottom just goes for a toss. 

I have been in recent times investigating how volatility can affect system returns and while there is no conclusion as such that I am willing to lay upon the table, I hereby present some charts which may hold a clue to what kind of markets the system does best in.

To start off, the 1st chart on the table is one where I have taken the Geometric Mean of the daily range (High – Low) and then calculated the Standard Deviation of the same period

Image

Its no surprise to see 2000, 2008 and 2009 being the top years in terms of both range and deviation from the mean. After all, we saw maximum volatility during these years. What is interesting for me is 2012 wherein Nifty gained 27% while Nifty saw the least amount of moves on a intra-day scale. 

The Weekly Range 

Image

and the Monthly Range

Image

do not show any major difference compared to the daily range (other than percentage change). The way to use the above dataset will be to see if there is any marked difference in system returns in years of high volatility vs. years where volatility was low. Depending upon the average holding period for the system, one can compare and contrast with one of the above charts to try and see what kind of markets appeal to the system and what doesn’t.

The reason to compare in my opinion would be to figure out whether bad periods in the past (system) were due to some factor that can be in hindsight seen as a problem area for the system (you may actually have to break-down the above chart on monthly scale since its unlike systems to under-perform for years unless the logic itself is hugely faulty.

For example, check this Equity Plot (Plot starts in Jan 2012 and is upto 15/04/2014)

Image

The system had a excellent run in the initial few months (Jan – Feb 2012 being a runaway bull market) and then more or less settled down until it had one fiery run (this taking place from late July 2013 to Early October 2013). In this period, it was not a run-away market, but one where you could see huge swings (Wide Range Bars being many in the months of August and September). The system seemed to be able to take advantage of the volatility. But once the volatility ended, even though markets have climbed steadily higher from that point onwards, the system has returned zero returns indicating that the system got caught with low volatile periods and lost money (more or less – Since October 15, Nifty is up by around 800 points while the system in the same time has actually lost around 400 points) . 

Good systems (which have sustained profitable periods) are tough if not impossible to create. Markets being dynamic, no matter what one does, markets always seem to be able to get the better of us. Its hence important that one constantly revises his views and strategies while at the same time keeping in mind the fact that even the best systems can have a long period of draw-down due to unfavorable market conditions. As they say, do not throw the baby with the bathwater.


Update for Nifty

In my last post on Nifty, I said that a swing trading system I use seemed to suggest a move to 6850 and that has been achieved. The question hence comes as to what next. On one hand, the mind being bullish, its tough to stay neutral and seek out whether there exists an opportunity for markets to fall. After all, I myself am a proponent of “Prediction is Impossible”, so it will be ironical if I start predicting where Nifty may go next.

Yesterday, Krishnakumar came out with his medium term target of 11000 on Nifty and while its easy to say that the target is too high, markets themselves have no memory of the past and forget 11000, even 16000 shall get achieved (its just a matter of time).

Coming back to Nifty, at 6850, are the markets over-heated. While on the short-term charts, many oscillators are indeed over-bought, on longer terms charts, there is still way to go before things become really overheated. For example, lets take RSI on the Monthly charts. As of now, its at 66 levels and 70 is considered to be the level above which markets are seen as over-bought. 

But overbought doesn’t mean a sell. Those who have read John Haydens on this aspect would known that its actually a stronger buy above 60. And this is the first time RSI on the monthly charts has closed above 60 since 2010. During the runaway bull market during 2003 – 2007, RSI on monthly only once slid below the 60 mark (when Nifty fell due to NDA loosing the election and worse, Left having a hand in the power). 

Markets follow a strong rally with a real long side-ways correction making the trader forget there had been one hell of a rally earlier and once could soon unleash once again. In fact, we become so used to this side-ways markets that when the real big one comes, we rarely are bullish since we cannot distinguish between this rally and the multiple previous ones that failed.

The 2003 – 2007 rally was not the first multi-year rally to occur in the Indian markets either. The biggest rally (if we are to take into account Sensex back-adjusted) happened between 1988 and 1992 when Sensex leapfrogged from sub 500 levels to 4500 level at the peak. Of course, after this we had a pretty long period without the high getting broken substantially. While the first break came in late 1999 / 2000, the bust of the .com in US meant that we had to wait for another 3 years before the older levels were broken once and for all.

After the peak in 2008, this is the first time we have closed above those peaks and hence its time to reflect as to whether this rally is similar to 2000 or 2003/07 for there in lies the question of whether Nifty will tough 11000 or 30000 (5x).

Unlike US, where there is ample amount of data on everything that has anything to do with markets, data is severely limited in India (unless you are prepared to shell out the big bucks and get yourself the best of the data feeds where you have access to a bit more data).

One way fundamentalists asses a stock is by looking at the Price Earnings Ratio. I have myself in my past Nifty posts used the same and here I post it updated till date

Image

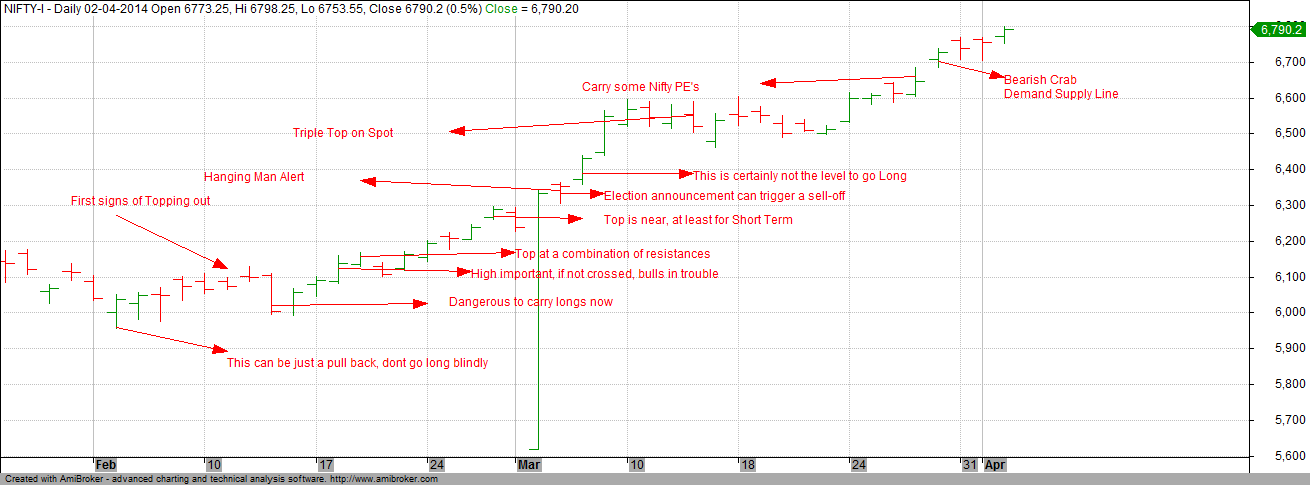
Markets have broken the previous high and currently is above its high of 2012 (Nifty high of 2012 was 6415 just for sake of comparison). 

Markets top out on back of Euphoria and I see none. In fact, yesterday when the markets were rallying strongly, all brokers I know of had more sell orders than buy. While the same size is indeed small, the fact that retail are selling out of the rally just doesn’t fit into the theory of markets being in a bubble phase which shall get burst anytime soon.

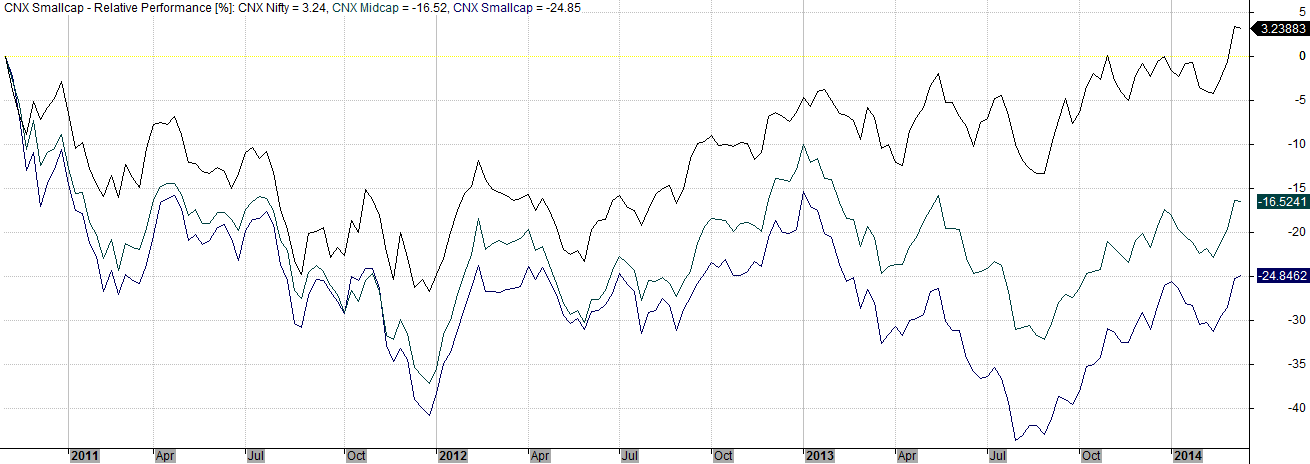
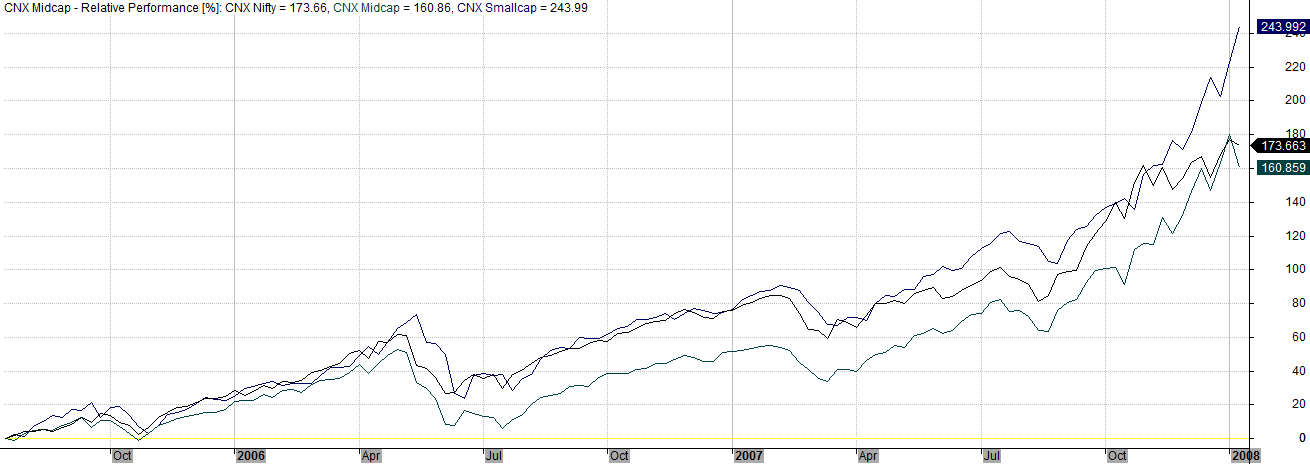
Lets for a moment move out of Nifty chart and look at broader index charts. First comes the CNX Mid Cap

Image

Forget about breaking 2008 / 2011 highs, this Index is just testing its 2013 highs as of now. Lets now head to the CNX Small Cap Index

Image

Similar is the story out here as well. Its not yet testing the 2011 lows (which unlike Mid Cap Index is pretty far off from the 2008 highs).

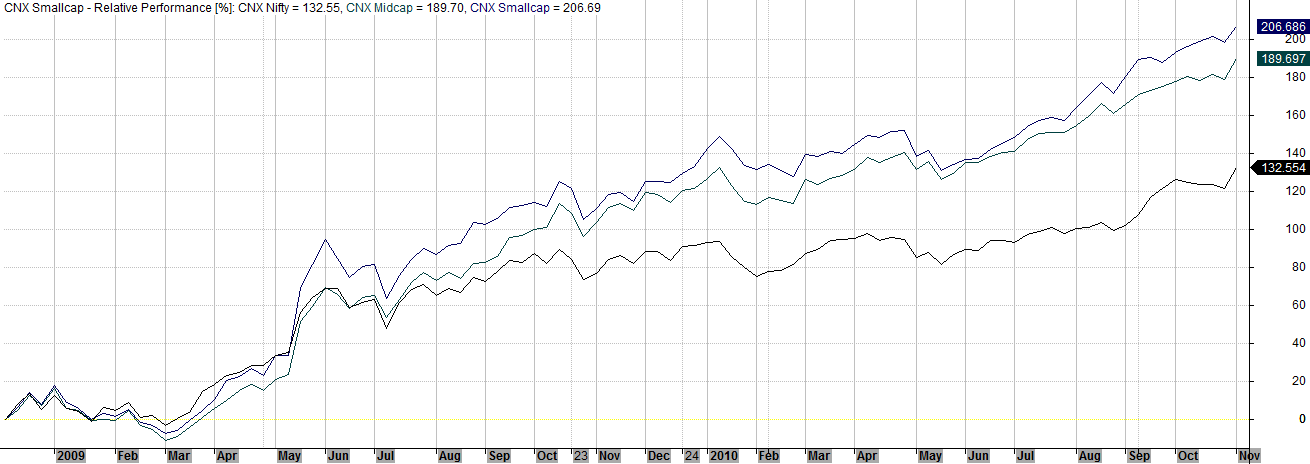
And finally the CNX 500 Index

Image 

Story is a bit better but nowhere as good as CNX Nifty with its 2008 peak still being un-tested.

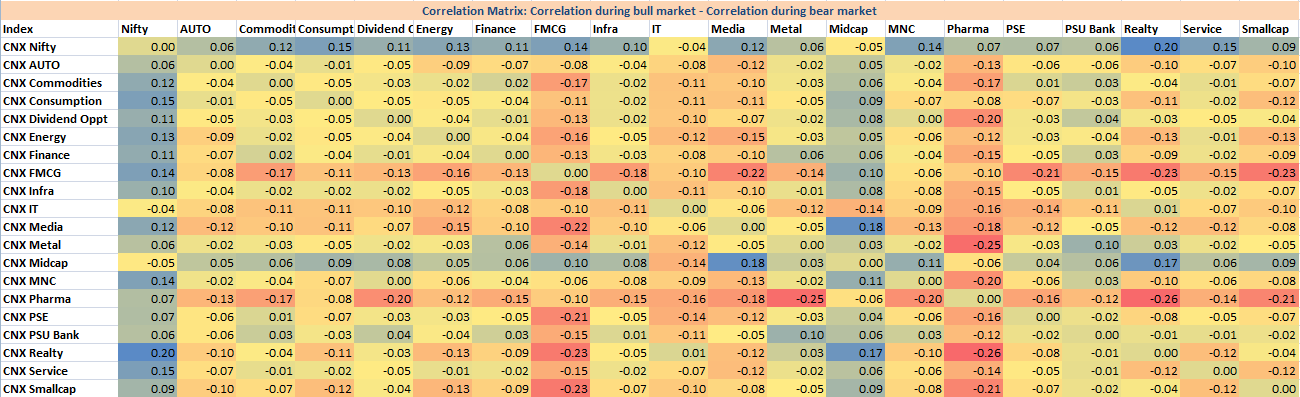
The reason for the wide difference (and this despite all these Indices being managed pretty efficiently by removing weak / dud stocks and inducting strong stocks) is due to the fact that this rally has been led by select sectors which were not the main drivers in 2008. Take Auto for instance. CNX Auto Index topped out in 2008 at near 2400 levels. Currently CNX Auto stands at 5950. CNX Pharma / CNX IT among too have a similar story to tell.

Once upon a time, Reliance was for the markets, what Tendulkar was for the Indian Cricket Team. Relaince moved the markets either way – a sort of bell weather. But today, no one cares about whether Reliance is up a percent or down since other stocks and sectors have firmly taken control of the Index.

For every fall and every rise, the public wants reason and the financial / media pundits are happy to oblige. Well before the 2008 bubble burst, small rises and falls were explained by Baltic Index, Japanese Yen among others. And right at that point of time, they seemed to be so correlated, that it made you wonder why you had not observed the same earlier. But while you were watching the statics that led the last rally / fall, markets and media had moved onto the next.

The US markets are on a free-fall as I write this (Dow down 200+ points). This even as today’s data point which was Jobless claims which came in lowest since 2007, theoretically a strongly bullish number, but wait, markets is focusing on something else for now and this hence takes a backseat. What the public evidently forgets is that Dow hasn’t seen a negative year since 2008. Even a 100 point fall would not do such a trend much harm.

According to the old adage, one should not lose sight of the forest for the trees. The markets is the forest that is made up of individual moves (trees). Its very easy to loose focus just at the moment you need to be totally focused. It comes down basically to the fact of what is your objective in the markets. Everyone is here for the money, but very few actually end up taking any part of it. Wealth Creation is the objective of most, but all I have seen is story after story of wealth destruction. 

A friend of mine was repenting that the Mutual fund he sold off after holding for 3 long years (and getting back the sum invested) had seen its NAV move up by 10% right after he sold the damm thing. When expectations are high and instead we see a disappointment, its easy to miss the larger picture of this not being a time to sell but a time to maybe add to the investment.

A person who invests today with the 11000 target in mind will most likely end up in a loss, not because Nifty will not move to 11K, it will, but because, he is not prepared for the pain that may come in between the time. If markets were to drop from here by say 350 points (a 5% fall), more people will throw in the towel than what the number who expect to do that today.

A guy who buys Nifty today IMO has to be prepared to withstand (if he is a long term investor and not wanting to look at the daily moves), a pain threshold of at the very least 25% (average draw-down from year high). Even then, if 11K is indeed reached, its still a good risk reward set up (reward being 60% above current price).

And before I conclude, here is another chart which again seems to suggest that we aren’t in the topping out process as of now. This chart is a plot of the % of stocks trading above the 200 day EMA. To ensure that it doesn’t suffer from survivor-ship bias, I have used a database which has both running stocks and delisted stocks.

Image

Between the first time it hit >70 numbers in 2009 till it finally made its high in 2011, Nifty appreciated by 40% and nope, it did not come without its fair share of drama :). And we had a negative divergence in his indicator to boot.

For quite some time I have held stead fast my belief that the time is not yet ripe for a rally of the kind we saw in 2003 or 2009 and have in an earlier post pointed out the same as well. One of my reasoning was that I felt that Modi was unlikely to become the next Prime Minister and markets will be dissapointed and be range-bound for the coming 2 – 3 years before we can see a massive rally.

But a look at the news as well as the odds supposedly offered for a Modi win seems to suggest that I am quite off the target in that prediction (though only the results can finally prove me right or wrong). The big question that needs an answer is, how shall the markets behave if Modi becomes a PM (since its more or less certain that markets will not take kindly to Modi not becoming a PM). Both in 2004 and 2009, markets surprised the expectations held by majority and this time shouldn’t be too different either. The only difference has been in the way markets have behaved in the months going into elections. While in the last two occasions, markets were more or less side-ways till the breakdown / breakout took place, this time, markets have already run up quite far and regardless of whether we fall from here or rise, we shall not see as much of a surprise as 2004 and 2009 was.

And now for bit of heresy 😉

Based on some statistical calculations, this is a note prepared for myself to see if Prediction is possible

Very High Probability (close to 100%) of Nifty falling 12% from its peak during 2014

50% Probability of Nifty falling 24% from its peak during 2014

11% Probability of Nifty falling 36% from its peak during 2014

Upper Range for Nifty – 7000 (High Probability), 9266 (Low Probability)

Assuming 7000 is reached and we form a peak round about there, we can then see a fall to 6160 (High Probability), 5320 (Medium Probability) or 4480 (Low Probability). Of course, all the above calculations are dependent on the peak we reach and changes as the peak value changes.

Adios for now, shall update my thoughts on Nifty after results are declared on the 16th of May.


Rally and the Noise

Its normally tough to make money in markets but when you add noise, its very easy to lose focus and forget the signal that is pointing the other way round. As a trader / investor, we are generally biased one way or the other. We read / analyze and tend to form a opinion based on the facts at hand. While we believe we are objective, it really is something we ourselves deep inside will have a tough time believing. 

What is worse than having a bias, is having a bias but not accepting the same. I follow several commentators who write / tweet on markets and its always amazing how while claiming to be unbiased in terms of where the market can go from here, always have a very strong opinion on what markets shall do. 

Markets in the last couple of months have made a run up of 14% since we made a low in Feb. While I myself was not sure if this rally had legs in the Initial stage, once we started taking out major resistances and then broke the all time high, there was not much of a question as to where the trend is. Of course, since I trade based on a trend-following system, my view in itself has little relation to what I do, but having a strong opposite view can play havoc with the mind making it tough to take positions as and when dictated by the system.

One of the guys I follow on twitter has been bearish (though doesn’t admit it) for quite some time and just as a time pass activity decided to analyze his tweets since the low of Feb. While I could not find one tweet which said “Buy Nifty” (only once was a Call Option asked to be purchased on Dollar Cost Averaging though it was asked to be quickly discarded once the average price was reached), here is a chart with the main tweets appended on it.

Image

The only way Noise can affect your trading is if you do not have a well tested & fully automated (in terms of Buy / Sell decision signals) system since its always tough to go against the grain (read herd). 

To close, a quote from @ReformedBroker “Be on financial Twitter to become a better investor, not because you think the guy tweeting stocks at you has a clue”

Nifty – Are we in a bubble / nearing a peak?

While we are once again testing multiple year highs, a question that was raised by a friend on twitter is whether stocks were up (rather participating) across the board or was this due to a few select stocks moving up the Index. 

While there are various ways to check, I have chosen the easiest way. Using the list of stocks that composed Nifty as on 8-11-2010 (the last major high for Nifty before this series of tests), I calculated the moves of each of them till 11-03-2014 (recent day when the Nifty made its all time high).

An Index is just an Index of multiple stocks and hence there is no way that all of them will be outperforming Nifty. What would be interesting to note is how many outperformed Nifty (more the healthier) compared to those that under-performed.

The difference of Nifty btw the above dates comes to 3.80% (amount of gains since its last major high). Of the 50 stocks that comprise Nifty, we saw 21 stocks outperforming that with average gains coming in at 47.50%. 1 Stock was positive though it under-performed Nifty. 27 stocks gave negative returns with average return being -37.40%

Nifty is calculated on basis of Free Float. If one had instead invested unformly in Nifty Index as on 8-11-2010, as on date the gains would have been 0.82%. The difference of 3% in returns would be due to 2 factors

1. We would have given more weight to under-performer as compared to weight in Nifty and same would have held true for out-performer as well.

2. The Nifty value (end value) I am using is that of of Nifty which consists of 5 stocks which were included into the Nifty after November 2010. They being better performers would have contributed in a small measure as well.

Despite markets at all time highs, this is not a bubble as is evident from most people denying that markets are bullish as well as there being no euphoria in the retail investor arena.

Finally a couple of charts

Here is the performance (relative) of CNX Nifty vs CNX MidCap vs CNX SmallCap. See how Mid Caps and Small caps are strongly under-performing the main index

Image


Here is the same comparison between 2008 (low) and 2010 high

Image


and finally performance between 2005 (July) to 2008 peak

Image


Notice how small caps were performing prior to the peak. Comparatively, this time around we are far from any such performance. While my own thought process is that we are unlikely to see a multi year bull run from here, that would not stop Nifty from moving to 7000+ or even 8K levels before turning around.

As long as the markets are bullish, I believe one should be biased towards long rather than trying to pick the top and missing the whole rally. To me, there is only one way to approach the markets. Be long with a plan B of where one would get off if the trend starts to reverse. Prediction is Impossible and attempting that is a fools errand.