Notice: Function _load_textdomain_just_in_time was called incorrectly. Translation loading for the restrict-user-access domain was triggered too early. This is usually an indicator for some code in the plugin or theme running too early. Translations should be loaded at the init action or later. Please see Debugging in WordPress for more information. (This message was added in version 6.7.0.) in /home1/portfol1/public_html/wp/wp-includes/functions.php on line 6114

Deprecated: Class Jetpack_Geo_Location is deprecated since version 14.3 with no alternative available. in /home1/portfol1/public_html/wp/wp-includes/functions.php on line 6114

Deprecated: preg_split(): Passing null to parameter #3 ($limit) of type int is deprecated in /home1/portfol1/public_html/wp/wp-content/plugins/add-meta-tags/metadata/amt_basic.php on line 118
nifty | Portfolio Yoga - Part 4

Is this a dip to buy

Nifty finally broke down today more than what we had seen in quite some time. The last time we had a 2% or more cut was way back on January 27th. While the damage seemed to be big in Indexes such as Small and Mid Cap, we need to understand that these indices are up quite strongly for the year even after accounting for today’s fall.

CNX Mid Cap is up 35.7% for the year while CNX Small Cap is up an astounding 53.6% for the year. It will take quite a few dips such as this to call it a buying opportunity.

While markets fell by 2.1% today, its interesting to note that markets have not seen a dip of 5% since 1248 trading days (last recorded dip being on 06-07-2009). What is interesting is that this is the current rally is 1248 days old – something that has not been seen since the beginning of the Indices themselves.

While passive index investing is not as famous as it has turned out to be in US, I do wonder what is the likely reason for such a large amount of time without a strong correction. In the 2003 – 2007 rally, we had 2 episodes of 5% fall, once when NDA fell and the second in 2006 (May).

To me, a better indicator of a Buy on dip would be when markets have declined by 3% in a single session. While that in itself does not mean that its the lowest point, historical evidence suggests that markets have indeed bottomed our round around those levels at least for the medium term.

This correction was very much overdue and unless the Finance Minister brings out something spectacular, markets seem more likely to be disappointed.

Test of Moving Average

A interesting use of Moving Averages is in Mean Reversion. While many trend followers swear by a Moving Average (or Moving Average Crossover), its interesting that the same can also be used for a Mean Reversion strategy (not that I would recommend doing that).

This pic from Wikipedia showcases the same

Image

We can measure a trend in various ways. One way would be to see the number of times it retraces to its moving average before continuing with its previous trend. Based on that though, here are the charts on the number of times Nifty has come back to the moving average.

All data for 2014 is till date (30th May)

10 Day Moving Average

10

20 Day Moving Average

20

50 Day Moving Average

50

100 Day Moving Average

100

200 Day Moving Average

200

Based on just a overall view, the data above supports the fact that trend following has been pretty positive this year compared to say 2013. But shall it remain with low volatility and not too may dips remain to be seen

Days since a 3% correction

Once again, this blog is based on a US blog which showed that Dow has had 600 days since seeing a 3% reaction. Since our markets are in itself in the middle of a good bull run, I figured out that it would be interesting to check out as to how many occasions we had seen a 3% reaction in Nifty as well as how many days had been spent from the time we had a 3% correction last time around.

Of the total of 5529 days of data I have, Nifty has seen a fall of 3% or more on 208 occasions. In other words, Nifty on an average has a 3% correction every 26.5 days. But then again, that is the average. Right now, we are 180 days from a 3% correction (last correction >3% was on 3rd September 2013) though this is not the biggest time frame we have had between such corrections. This is not even the 2nd longest but is as on date the 5th longest time between 3% or more correction.

But what interested me was not the days that we spend now but how the reactions were more often seen during the bull run of 2003 – 2008. In fact, the highest days between a 3% or more reaction then was 155 days (in 2006). The trend seems to have changed not in 2009 when markets shot up substantially but in early 2010. Would be interesting if this indeed is a change in terms of markets not seeing a substantial correction for more days than what has been the trend earlier.

Image   

Nifty Performance vs. PE Ratio

One of the key numbers I look at regularly is the PE ratio of Nifty to have a idea as to the valuation Nifty currently commands and whether markets are cheap, expensive or neither of the two.

For quite some time now (since mid 2011 to be precise), Nifty PE ratio has been moving around its long term average. Only once did we see a major dip which brought the PE to its 1 Standard Deviation on the lower side. 

Image

As on date, the current rise has meant that we are closing in on the 1 Standard Deviation on the upper band though even that is bit far away. But what is interesting is how does the PE compare to the return of Nifty.

Since 2008 low, Nifty has appreciated by 150%, Nifty PE has appreciated by just 85%. But more interesting is the way this has been accomplished. Lets first take a look at the chart;

Image

After the markets bottomed out around October 2008, we witnessed a steady recovery post the bottoming of the Dow in March 2009. But even as the markets were dipping in the first couple of months of 2009, PE was already starting to move higher indicating the impact of bad results which were pushing up the valuation of Nifty even as Nifty itself did nothing.

This can be seen till the early part of 2011. Nifty doubled from the lows, the PE out performed it (in essence markets became pretty expensive in a very short span of time). To get a handle on how expensive Nifty was, do note that the high point was above the 2 standard deviation (which was seen earlier in 2008). 

But from that point on wards, things have changed tremendously. Markets started to outperform the valuations (in other words, even as markets went up, quality of earnings meant that valuation wise, markets were still cheap). 

I believe that unless we have another major global meltdown, this gap will only increase further. In hind-sight, markets seem to have been a buy on dips since early 2011. Question though is, is that strategy still a valid one? I for one believe so.


Are markets still worth buying into?

The current surge in prices has placed me in a quandry as to whether its still a good time to invest in the markets. While Infrastructure Index is up by 20.6% this month alone, we still are way way below compared to the glorious heights that was reached in 2007. Same is the case with a lot of other sectors as well, Realty, Metals PSU Banking Sector being the top dogs that have performed brilliantly in the current month while still being far away from their all time highs.

I believe that we may be entering a new stage in terms of how markets move from here. On one hand, there is huge amount of hope in the market with regard to the prowess of Modi. This has been the key reason for us to see such a rally even before Modi has assumed power as the Prime Minister of India. On the other hand, Modi is not P.C.Sorcar and over exuberance is sure to meet a gory end – not because he cannot deliver what he promises, but because the market just has run way ahead of valuations and all the low hanging fruit may have already been eaten away.

FII’s have been one of the key drivers in the market and in fact have been on a buying spree for quite some time. It was hence a surprise to see them turn bearish (though the amount is piddly) today. On one hand, this may be one of the off days, but on the other, this may also be the start of a profit booking season which if history is any guide does not bode well for markets.

In one of my previous write-ups on Nifty, I showcased as to how Nifty was nowhere near the top as in previous occasions, Nifty has topped out when the small cap index starting to beat the broader index black and blue. On that thought, do take a look at the chart below

Image

The small cap Index has really taken off in the recent times and I wonder whether we may have (or may) see a peak for the short to medium term. On the long term though, the trend is yet to exhaust as can been seen in the chart below (longer time frame)

Image

The above chart was discussed by me in early march in this post http://prash454.wordpress.com/2014/03/12/nifty-are-we-in-a-bubble-nearing-a-peak/ and the difference in returns since the time of writing that post is stark. Its interesting to note that despite the sharp rally we haven seen in the last few days, Mid and Small cap Indices are still bit off from the Nifty in terms of returns and only when they start exceeding the returns generated by Nifty should one start taking measures to lower the exposure to markets.

That said, the markets never behave / move in the direction vastly anticipated and what worries me most is the bullish stance taken by almost all broking houses. Below is a list of such targets I was forwarded on WhatsApp

* CIMB Raises Nifty target to 8,150
* BofA-ML raises Sensex target to 27,000
* BNP Paribas raises Sensex target to 28,000
* Citi raises Sensex Dec target to 26,300
* Macquarie raises Nifty target to 8,400
* Deutsche Bank raises Sensex target to 28,000
* CLSA raises India weightage by 2%
* Nomura raises Sensex target to 27,200
* UBS raises Nifty Dec target to 8,000
* ICICI Securities sets Nifty target of 8,100
* Religare raises Sensex target to 27,000
* Goldman Sachs Raises Nifty target to 8,300

For the life of me, I cannot remember when was the last time when we saw every broking house being so bullish about the future. And if every one is a buyer, we either should see a unprecedented boom (somewhat like what we saw in the 2nd half of 2007) or maybe we can take a break here before the next phase of the rally starts.

Either way, I believe that for now the future does look good. As long as one picks companies that won’t go bust anytime soon and avoids leverage (unless you have a full fledged trading system in place), the coming decade maybe the time to generate wealth on the scale one saw happen when markets relocated from 2003 to 2007.

Adios for now 🙂


Post Election thoughts

While Nifty did close positive, the very fact that we gained just about 100 points for a victory of the kind unseen since 1977 (non congress) does in a way reduce the enthusiasm about whether markets are really ready to take off or are we seeing a topping out formation.

On one hand, this move of today has a precedence in the way markets behaved on the day of results of 2004. Nifty closed with a small positive despite the fact that NDA which was seen as the front runner to the next government came up short and instead it was the Congress supported by the Left parties who were staking their claim to power. What happened in the next two days is history.

With the comprehensive victory for Modi, I believe most broking houses will start upgrading their targets for Sensex / Nifty on the back of optimism generated by the slogan of Modi “minimum government maximum governance”. In fact, UBS has already confirmed its target of 8000 for Nifty.

They key question is, Shall we see a run away rally? On the basis of evidence (some of which I shall present here), I guess not. But what I am sure off is the fact that this could be a turning point in the Indian Economy. The last such turning point in my opinion was the 1991 elections where P V Narasimha Rao took over the Premiership after India’s first experiment with coalition politics had brought the economy virtually to its knees. Over the next 5 months, Sensex rallied by around 29% (in hind-sight though, this was the led by Harshad Mehta). Since the markets never re-tested levels seen in the first few months of PVN, I believe that genuine progress in between (with economy being opened up) added up to the rise in markets and all of it were not due to the scam.

Where we do differ from 1991 is in terms of how cheap or expensive the markets were at that point of time. Right now, Nifty trailing PE (Standalone) is around 19.5 while Sensex PE when PVN took charge was 15.5. But since Indian economy was closed and we were growing at a much lower pace, this additional risk is not as big as it appears to be. 

Small and Mid Cap index stocks are generally those having high beta and hence these stocks tend to ourperform the large cap indices. A look at the past data seems to suggest that markets tops have been accompanied by strong out-performance of Small Cap Index vs Nifty whereas at the current juncture, all Indices seem to be moving in tandem and there appears to be still some way to go before a major top is made.

Chart 1 – RS comparison of CNX Small Cap, CNX Mid Cap and CNX Nifty

Period: Jan 04 – Dec 07

Image

Chart 2 – RS Comparison of the same indices for period Oct 2008 to November 2010

Image 

  Chart 3 – the current stage. Time period starting from Jan 2012

Image


In the second pane of the chart below, I have plotted the Net New Highs in NSE. This is a way to gauge the breadth of the market since if markets are moving higher with very few stocks making new yearly highs, its just a matter of time before such move collapses. 

I have marked in a box the period from the election results of 2009 to the top we saw in late 2010. One can see the consistent nature of the new highs. On a similar nature, I believe that we are just seeing the start of a run up as its just recently that the Net New Highs has broken into positive territory.

Image

In recent times, whenever India has seen a strong government at the center, markets in the next one year have given pretty good positive returns. The only times when this did not happen was in 1999 when NDA formed the government. The hitch if one were to say is the fact that we have been strongly out-performing the world markets (majority of them) in a big way even before the ink on the fingers (elections) were set. 

During the last days, we saw the release of CPI for the month of April which came in at 8.59% and March IIP data which once again was in negative territory 0.5%. With Diesel prices being raised by 1.09 right after the elections got over, Inflation numbers over the coming months will not be easy to vanquish. This is seen by the strong yields  in Government Bonds which despite the euphoria closed yesterday at 8.83%. 

Below is a Nifty chart with the lower panel showing the number of days since the 200 MA was breached. As can be seen, we are nowhere close to new highs but at the same time, we are coming in close to the highs reached after the market topped out in 2010.

Image

Another way to look at the above data would be to measure the % difference between the current price and 200 MA and the same is plotted in the chart below

Image

Once again we can see that this rally is nowhere comparable to the ones we had seen earlier before markets topped out for the medium to long term despite Nifty trading at its all time highs.

Even in a bull market, markets do not go up in one straight action but is pretty choppy on the extreme short term. As can be seen in the chart below, Number of occasions when Nifty suffered a loss of 5% of more during the bull phase of 2003 – 2008 is much higher than the ones we have seen since 2010. In fact, we have seen more instances of 5% up over 2 days than 5% down over 2 days, but as the market evolves, look forward to more of them.

Image

The Narendra Modi government that comes to power is coming with the highest expectation one has ever seen (since 1977 I assume) and that in itself can turn out to be a negative for markets since its not easy for even a guy who has showcased the development of Gujarat to turn around the story overnight. 

At the same time, I believe that the next couple of years provide one the best opportunity to set up the foundation for what Rakesh Jhunjhunwala will call “The mother of all bull rallies”. As I sign off, here is me, hoping for the best 🙂


Betting on Elections – Gambling or Trading

On Twitter, its amazing to see the number of winners who seem to be right in whatever trade they report (mostly after the move) and in an attempt to get them to commit to something, commented that I was going into the election result day with “Long Nifty” positions.

Good friend, Nitin of Alpha Ideas replied back with a quote by “Paul Tudor Jones” and I quote the same here

“I don’t risk significant amounts of money in front of key reports, since that is gambling, not trading”

Now, unlike the hundreds of quotes available, this is from a guy who is seen as one of the Top Technical Analysts ever (Link) and hence something that cannot be dismissed off hand (as I generally tend to do). This guy has some serious skin in the game (as against the guy who invented that term but seems to spend more time talking than trading – but that is for later:) ).

In many ways, trading is generally seen as Gambling though the gulf between gambling and trading is as wide as the Brahmaputra at its widest point. A gambler is one who takes risk with not much of a risk management and generally in a place where the odds of winning are pretty low.

The big question out here is, If I am positioned for the election result – am I gambling or this is as normal a trade as any other I take? To answer that, let me give you the thought process that made me willing to bet (and I generally bet as much as I can afford – no half measures out here) and why I believe that if one looks at history (and TA is all about the history repeating itself), betting on the long side is the way to go.

I am a believer in positional systematic trading and believe that intra-day trading or discretionary trading (gut based or based on ideas that cannot be historically tested to see its accuracy) is not the way to go. I am also a strong believer in trend following since evidence has shown that all said and done, for some reason that is as yet not explained, trends do persist more often than they are supposed be. 

The big profits of a trend follower come from the outlier’s – moves that are 3 / 4 or even 5 standard deviation from the mean and which theoretically should not occur in decades or centuries but which happen more often that not. Its the outlier that ensures the profitability (extra Alpha if I may say) of a trend following system since it generally has more loss making trades than profit making and these one off trades more than compensate for all the losses.

Outliers can occur due to various reasons – Known events and Unknown events. Election results are a known event since regardless of what happens, results will be out by day’s end. On the other hand, a attack on the World Trade Towers in 2001 was an Unknown event since no one knew such a thing could happen.

A couple of years back, I had given a talk on Trend Following and showcased as to how markets seemed to be perfectly aligned with the post event trend even though in case of unknown events, the very event was a surprise. Let me take you through some of the examples I provided in that talk

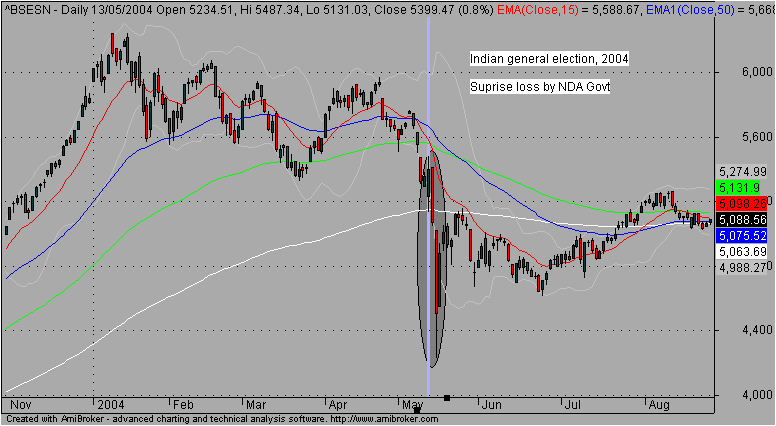
1. Fall of BJP led NDA Govt in 2004

Image

As can be seen, in the run up to the results, despite the euphoria of “India Shining”, the markets were considerably weak. Markets closed with small gains on result day and tumbled in the next couple of days.

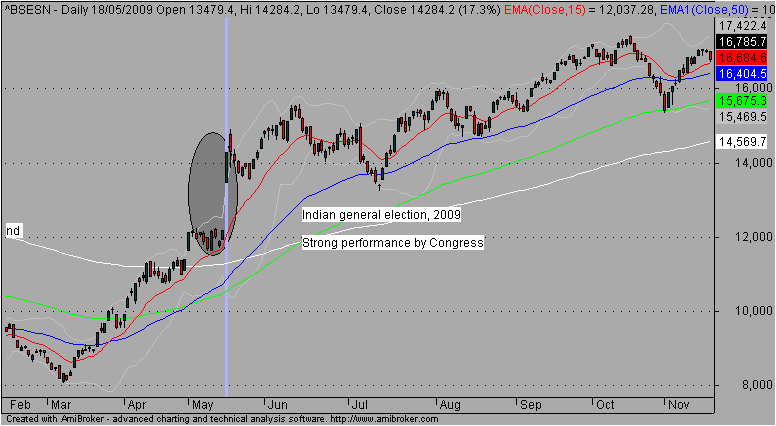
2. UPA wins the election in 2009

Image

Now, this was supposed to be so big a surprise (especially that of Congress along mopping up >200 seats) that Index froze higher. But look at the chart and say that the trend was anything other than bullish

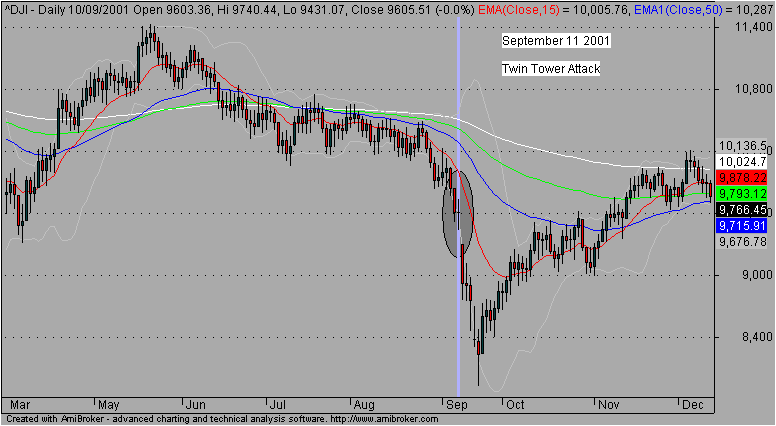
3. Terrorist Attack on World Trade Towers

Image

Now, this was a unknown unknown event of a magnitude not seen in a very long time and yet, Dow was strongly bearish before the event and the only thing that this did was accelerate the fall when markets re-opened.

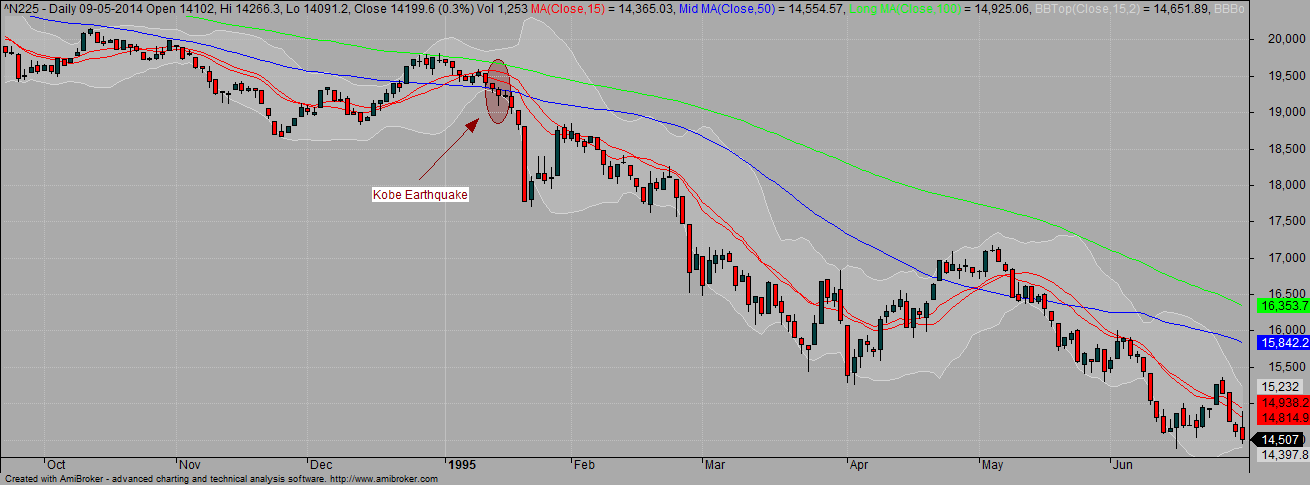
4. Great Hanshin earthquake, Kobe Earthquake

Image

Japan was rattled by the Kobe earthquake and in a in-direct way was the cause of the fall of Barings Bank (Nick Leeson). One look at the Nikkei chart above, the trend was already present and in fact, it was only 2 days after the earth quake happened that Nikkei started to crack strongly.

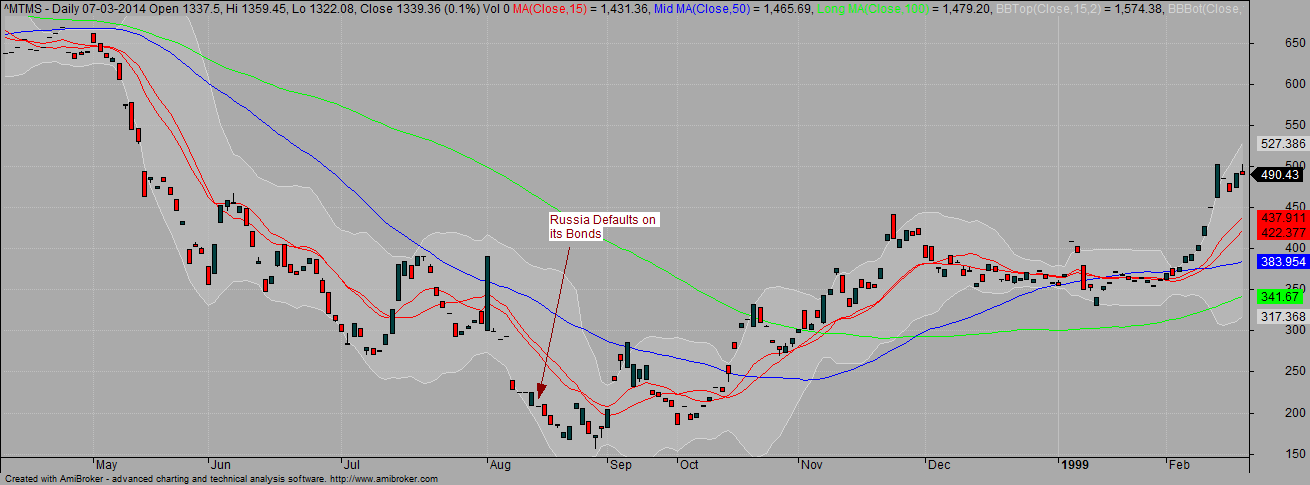
5. Russia Bond Default

Image

Russia in 1998 defaulted on its own loan and this in a way shook the world markets then. The default was the key catalyst to the end of one of the biggest hedge funds of that time – Long Term Capital Management. Look at the trend and say that the markets had no clue about it

I believe if one were to dig deep, one can find even more examples of how the markets were most of the time in line with the trend well before the event and the event in itself was not a surprise to anyone other than maybe those in the media.

My own bet on the markets today has been based on a system I trade and has been tested both historically and in real time for quite some time now. Add to it, unlike 2009, this time around, the trends and the results will be during market time and shall not be a surprise at the open.

Its easy to rationalize as to why one should not trade before key events, but as I have shown in the examples above, if you are with the trend, there is little to fear about.