Notice: Function _load_textdomain_just_in_time was called incorrectly. Translation loading for the restrict-user-access domain was triggered too early. This is usually an indicator for some code in the plugin or theme running too early. Translations should be loaded at the init action or later. Please see Debugging in WordPress for more information. (This message was added in version 6.7.0.) in /home1/portfol1/public_html/wp/wp-includes/functions.php on line 6114

Deprecated: Class Jetpack_Geo_Location is deprecated since version 14.3 with no alternative available. in /home1/portfol1/public_html/wp/wp-includes/functions.php on line 6114

Deprecated: preg_split(): Passing null to parameter #3 ($limit) of type int is deprecated in /home1/portfol1/public_html/wp/wp-content/plugins/add-meta-tags/metadata/amt_basic.php on line 118
Portfolio Yoga - Part 82

Indian Presidents and Sensex Returns

Of the many well known cycles in the market, one such cycle is the Presidential Cycle. This is applicable only to United States.

Quote about it from Investopedia:

A theory developed by Yale Hirsch that states that U.S. stock markets are weakest in the year following the election of a new U.S. president. According to this theory, after the first year, the market improves until the cycle begins again with the next presidential election.

While India follows the West Minister style of governance and hence we should maybe just replace the President with the Prime Minister, it does not work since there is not much of a fixed tenure either of the Prime Minister or the election themselves.

While our President has a fixed tenure and almost all of them have lasted their time, owning to he not being the decision maker as the US President is, there is not much of an influence he can create on the economy.

But I felt it would be interesting to analyze how the markets have behaved during the tenure of various Presidents starting from Giani Zail Singh and here are the results,

 Image

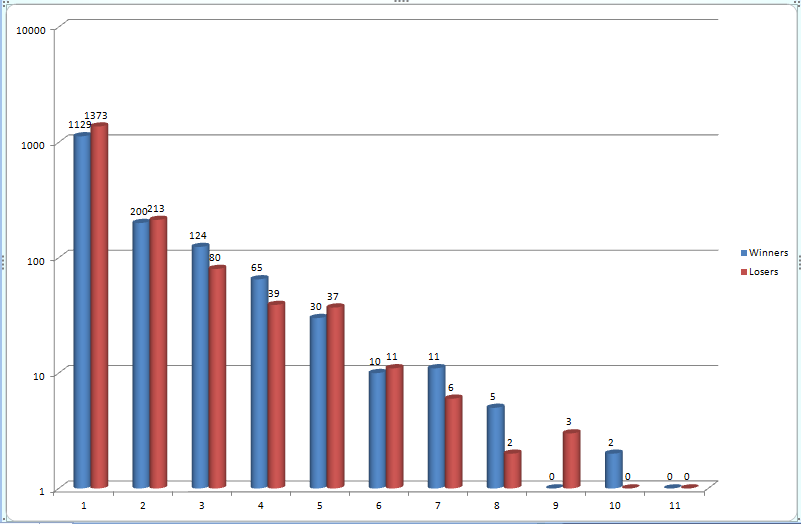
Average Performance of the market during the 1st year of the President Term is the lowest with Year 2 and Year 3 competing head on head.

 Image

The biggest gain came in the 3rd Year of Zail Singh when Sensex doubled. K R Narayan on the other hand saw 4 of his 5 years Sensex ending in Red.

 Image

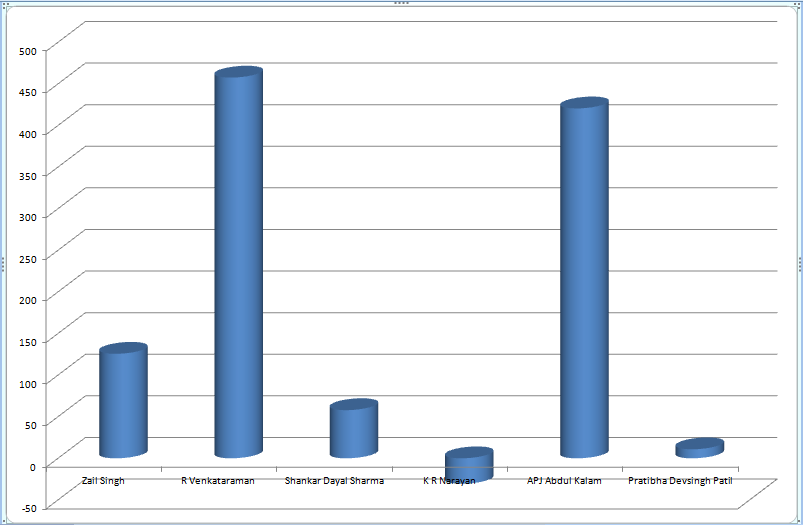
And finally, percentage returns of Sensex during their respective terms.

The first year of Pranab Mukherjee saw a return of 12%. With 2nd being positive across all Presidents, shall we see a continuation of the ongoing bull rally?


Consecutive days of Wins and Loss in Nifty


When Nifty closed in Red on Friday (8th Nov 2013), it was the 37th occasion that we have seen Nifty Current Month running futures close in negative for the 5th day running. The chart below (which is plotted on Log Scale) shows the occasions of number of Winning / Losing streaks. 1 means that the Win / Loss was just one day before it turned around. 

Image


BSE Sensex vs. S&P 500 (US) – Year by Year returns comparison

The chart below displays the returns of BSE Sensex vs. S&P 500 of US since 1981 till date (November 7). What is interesting is that since 2003, we have outperformed S&P 500 on every positive occasion and under-performed S&P 500 whenever the year ended in negative territory. I have used the Open and Close to determine the returns. 2013 seems to be the first occasion when S&P is strongly performing on the positive side compared to the Sensex since the start of the secular world wide bull market of 2003.

Image


Risk of buying a Wrong Lingerie

Sorry for the tongue in cheek name for the post, but then again, what can explain such a wide difference for choosing the wrong brand 😉


Image


Since the time of listing of Lovable lingerie, the stock has returned a measly 30% return vs. the 215% growth seen in Page (Jockey).


CNX Realty – A bullish thought

CNX Realty has been one of the worst performing indices over multiple time frames since its peak in 2008 (January). While it has moved more than 18% from the low, it still trades well below 10% of its all time high. 

In recent times, there has been a plethora of reports on how the sales of real estate has dropped resulting in many developers holding onto their apartment / office complexes at great cost rather than reduce the price and take a hit. 

On the charts though, we seem to be seeing multiple signs of a bottom in process. As with everything else, trying to buy a beaten down sector / stock is fraught with higher risks than betting on those that are already in a good bullish phase.

Here is the CNX Realty chart 

Image


Since CNX Realty index cannot be traded (bought into), the next best way is to trade the best stocks in that sector. Here is a Relative Strength comparison of the constituents of those stocks that form part of the CNX Realty Index

Image


As can be seen in the chart above, the best stocks are Phoenix Industries / IB Real and Prestige. Of course, as with all things in market, there is no guarantee that these stocks will return a better risk adjusted return compared to say the worst performer – HDIL. But when betting on already weak sector, its better to be with the stronger ones than the weaker ones.