
Global Retirement Dilemma may not affect India
nimble-builder domain was triggered too early. This is usually an indicator for some code in the plugin or theme running too early. Translations should be loaded at the init action or later. Please see Debugging in WordPress for more information. (This message was added in version 6.7.0.) in /home1/portfol1/public_html/wp/wp-includes/functions.php on line 6131restrict-user-access domain was triggered too early. This is usually an indicator for some code in the plugin or theme running too early. Translations should be loaded at the init action or later. Please see Debugging in WordPress for more information. (This message was added in version 6.7.0.) in /home1/portfol1/public_html/wp/wp-includes/functions.php on line 6131
Care ratings plotted on the stock price

Links:
http://www.careratings.com/findratings.aspx?cid=5047&year=2012
http://www.careratings.com/upload/CompanyFiles/RR/Shree%20Ganesh%20Jewellers%20Limited-03052012.pdf
http://www.careratings.com/upload/CompanyFiles/PR/Shree%20Ganesh%20Jewellers%20Limited-02052013.pdf
http://www.bseindia.com/corporates/anndet_new.aspx?newsid=73e25dff-0fcf-478e-b9a7-16ae5c7a8410
One of the worst performing sectors, Infra in recent times has been showing a steady rise though when one looks at the bigger picture, the damage is still very much visible. But then again, if Indian growth story recovery has any merit, Big Infrastructure stocks will be the ones’s which will deliver strong returns compared to the risk. Smaller infra stocks may generate higher return but is more risky in case the sector turns around back to bearish territory.
Lets first look at the CNX Infra Index;

While the Index has recovered from its lows, there is no sign on the weekly charts signalling any turnaround. The Index consists of 25 stocks (List here) though L&T, Bharti Airtel and NTPC make up nearly 55% of the weights.
Since the Index composes of too many small tickers as well, this post will instead concentrate on the few biggies and see if there are any opportunities present.
ABB:

ABB recently came pretty close to the lows it made in the panic of 2008 before bouncing back. While the bounce has been pretty decent, its still not out of the woods as it encounters a major resistance at 700. On the weekly chart (shown above), you can see a formation of a inverse head and shoulder. While not textbook in terms of the placement of the right shoulder, a break above 700 can still be considered a valid neckline breakout for a move up to 900 where it meets its next major resistance point.
BHEL:

While ABB & BHEL should show similar trends, the fact that BHEL is a PSU means that there is a lower weight for it as against the Multinational ABB. As can be seen in the chart, its still well below its major resistance zone and since it not only broke the 2008 panic lows but went way below, the stock is best avoided unless one wants to punt specifically in BHEL
Larsen & Tourbo

Between 2012 and now, L&T has moved in a very wide range and is once again close to its major resistance level. The stock having already having made a strong recovery while looking attractive has a higher risk as and when profit booking emerges.
Siemens:

The chart of Siemens is more or less similar to ABB though we are yet to see the formation of the right shoulder. A break above 630 though should be a valid reason to buy since the next major resistance zone comes in at 800. On the other hand, if the stock reacts from here, one can establish a long once we sense the right shoulder being formed.
Thermax:

While Thermax figures on the last stock in this post, its the best opportunity among the stocks we reviewed above since the stock has already given a breakout. Any pull back to the breakout zone of 640 can be used to add to longs with the target being 800 in the next few months.
To conclude, while infra stocks are showing some amount of strength, save for Thermax, the rest of the stocks are yet to give low risk entries. If market continues reacts from here, these stocks are best avoided since being weak, they will be the first to come under pressure.
Prof. Sanjay Bakshi had a recent article on why he bought Thomas Cook. You can read the same out here,
http://fundooprofessor.wordpress.com/2013/12/01/why-i-bought-thomas-cook/
So, how does the stock look Technically?
Here is a Monthly Bar Chart

As can be seen, we are sitting just below a multi year resistance line. If the stock crosses & closes (on monthly timeframe) above 85, we should be able to see the high of 2007 (142) which in itself would mean a move of 67% from the breakout levels.
On the web, there is a lot of material on how Full Moon and New Moon affect a variety of events on earth and the stock market is said to be no exception either.
Here are some links you may want to glance through,
http://emf.sagepub.com/content/12/1/107.abstract
http://www.theidiotandthemoon.com/moontrading.html
http://papers.ssrn.com/sol3/papers.cfm?abstract_id=1366663
Above and many others which can be easily searched for seem to suggest a linkage between Lunar Cycle and Market Returns. But as a trader, the question we need to get an answer for is
Does the linkage have predictive ability?
If we can see a Predictive ability in terms of Pre and Post Lunar day, we can then use that information to modify the style of trading to take advantage of the same.
For this test, I used BSE Sensex (since the history is the largest available among Indian Stock Indices).
Period of testing was from 1980 to 2013 (November)
Not being a statistical does limit the amount of tests I can run.
The first thing I wanted to do was compare and contrast (correlation in other words) the average returns of 5 days Prior to the D day to the 5 days Post the D Day.
Reason for choosing 5 (and not 4 or 6): A month consists of 30 days which is equal to 2 Lunar Cycles. In a 30 day month, we generally have markets open for around 20 days (Saturday / Sunday being holidays). 20 divided by 2 = 10 and hence I have used 5 for post information and 5 for Pre information.
While the time frame is long enough to dismiss Sample Size Bias, there is still a problem in terms of Lunar Days which fell on either Sunday / Saturday or a Holiday. Since the whole excercise was done in AmiBroker, it has omitted days when there was no data and hence the test may not be complete in all respects.
But since this can affect both New Moon and Full Moon, I believe that the probability of they cancelling each other is high and hence do not believe that they will affect my conclusions in a great manner.
Now for the raw results:
The Correlation between return (average) of 5 days prior to Full Moon compared to 5 days post Full Moon = 0.05
The Correlation between return (average) of 5 days prior to New Moon compared to 5 days post Full Moon = 0.01
The correlation being so close to Zero essentially suggests that returns are random in nature and there is no way to guess as to if markets will rise in the next 5 days if they have fallen 5 days prior to the D day.
Below is the other data points I thought may give some indication of the returns as well as the probabilities;

The only thing that caught my eye was that regardless of whether the previous 5 days were positive or negative, the next 5 were positive. But this can be easily explained by the fact that the markets have moved tremendously over the same period. The best way to remove that bias would have be to Zero Center the same, but that is for some day in the future 🙂
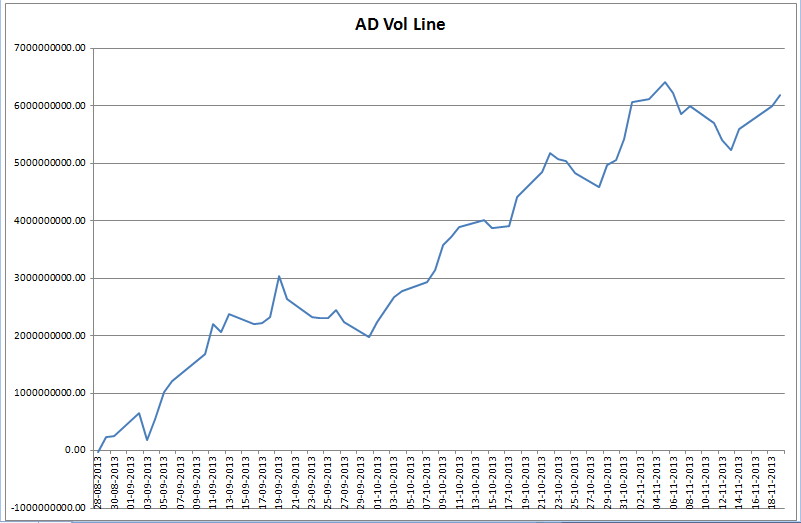
A rally is said to have legs if the move is accompanied by strong volumes. One such indicator to measure the breadth of a market is the AD Volume Line. You can read more about the indicator here: http://stockcharts.com/help/doku.php?id=chart_school:technical_indicators:ad_volume_line
Below is a chart of the same calculated on stocks forming part of CNX 500 from the day market made a major bottom 28/08/2013 till date (19/11/2013).
Over the last 1 year, Bank Bees has returned a negative 1.22% ROI. Dedicated Bank Sector Mutual funds on the other hand have done much worse save for ICICI Prudential Banking and Financial Services Reg.
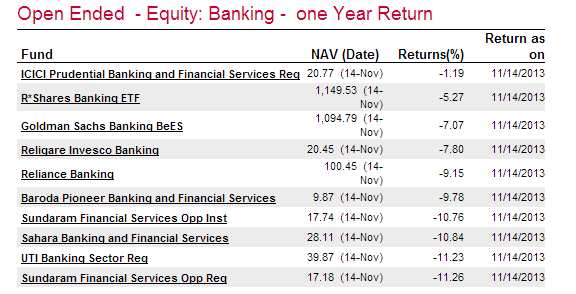
UTI Banking Sector fund seems to have done far worse despite its current portfolio showing it having its top 3 investments to the tune of 66.84% in Private Sector Banks.
Internationally there has been a lot of evidence of how in the long run passive investing by investing into low cost index funds is a much better compared to active investing. Unfortunately lack of ETF’s in India is a big limiting factor when one wants to invest beyond Nifty / Bank Nifty.