Notice: Function _load_textdomain_just_in_time was called incorrectly. Translation loading for the restrict-user-access domain was triggered too early. This is usually an indicator for some code in the plugin or theme running too early. Translations should be loaded at the init action or later. Please see Debugging in WordPress for more information. (This message was added in version 6.7.0.) in /home1/portfol1/public_html/wp/wp-includes/functions.php on line 6114

Deprecated: Class Jetpack_Geo_Location is deprecated since version 14.3 with no alternative available. in /home1/portfol1/public_html/wp/wp-includes/functions.php on line 6114

Deprecated: preg_split(): Passing null to parameter #3 ($limit) of type int is deprecated in /home1/portfol1/public_html/wp/wp-content/plugins/add-meta-tags/metadata/amt_basic.php on line 118
Uncategorized | Portfolio Yoga - Part 18

Stock of the Day – GMDC

Gujarat Mineral Development Corporation is the latest stock that seems to be trying to ride the Modi wave. The stock which for a long time was a pretty good market performer took a serious plunge in 2013 with the stock falling by 65% in a matter of months. The stock has since slowly crept higher and today made a fresh breakout from its recent range.

While the stock continues to remain weak on the longer time frame, the breakout coming in at the 200 EMA level does provide for a low risk entry with the initial target being at the very least 24% above the current price. 

A weekly close below the 200 day EMA would on the other hand communicate the failure of the breakout and would be a good stop loss to consider.

Image

Stock of the Day – Infosys

Since last April, Nifty has appreciated by around 10% while CNX IT in the same time frame has gone up by 57% (this after taking into account the loss of 4.2% in one day – today). IT stocks have been one of the key performers in Nifty until banking stocks started to perform better in recent times (though Bank Nifty is well below its all time high owing to the lacklusture performaces of Public Sector Banks). 

A correction in IT stocks was hence well over-due and the initial trigger over the last few days has been the concern about the appreciation of the Rupee vs. the Dollar (never mind that Rupee is a long way from where we started the current depreciation journey).

Today though, IT stocks fell pretty strongly on opening bell itself owing to yesterday’s comments by Narayana Murthy where he forecast weak revenue growth in the March quarter at an investors meeting organized by Barclays. This was a pretty strong surprise owing to companies generally not commenting on the performance well before declaration of results and in recent times, the surprise has come when results were released rather than times like this.

While Infosys was hard hit today with the stock falling by 8.5% at close, its not as if heavens have broken loose. The long term trend of Infosys is still pretty strong and even after the fall, the stock is under no risk of getting into bearish territory. 

Old timers may well recall that during the time when Murthy was leading Infosys, the company used to Under promise only to finally end up beating both its own and Analysts estimations. So used to this phenomeon were the markets that when during the results declared in April 2003, he cut down on the Guidance substantially, the markets were so taken aback that the stock collapsed by around 26% during the day (the single largest percentage fall the stock had seen in its history). In hindsight though, that was the most opportune time to buy the stock as it has never looked back.

Today’s fall though comes with a very different context in the sense that the stock is pretty bullish and this is the first major fall we have seen in the year. If Rupee continues to appreciate, profit booking may be seen in IT stocks owing to they being directly affected as well as the tremendous gains investors have seen and hence while the stock still is a screaming buy according to charts, the margin of safety if one were to put it is on the lower side.

The accompanying chart shows what I believe will be the major support zones if the stock continues to drop. For the stock to be seen as bullish, I would like it not to break the 2990 levels which is a very major support zone. 

Image


Nifty – Are we in a bubble / nearing a peak?

While we are once again testing multiple year highs, a question that was raised by a friend on twitter is whether stocks were up (rather participating) across the board or was this due to a few select stocks moving up the Index. 

While there are various ways to check, I have chosen the easiest way. Using the list of stocks that composed Nifty as on 8-11-2010 (the last major high for Nifty before this series of tests), I calculated the moves of each of them till 11-03-2014 (recent day when the Nifty made its all time high).

An Index is just an Index of multiple stocks and hence there is no way that all of them will be outperforming Nifty. What would be interesting to note is how many outperformed Nifty (more the healthier) compared to those that under-performed.

The difference of Nifty btw the above dates comes to 3.80% (amount of gains since its last major high). Of the 50 stocks that comprise Nifty, we saw 21 stocks outperforming that with average gains coming in at 47.50%. 1 Stock was positive though it under-performed Nifty. 27 stocks gave negative returns with average return being -37.40%

Nifty is calculated on basis of Free Float. If one had instead invested unformly in Nifty Index as on 8-11-2010, as on date the gains would have been 0.82%. The difference of 3% in returns would be due to 2 factors

1. We would have given more weight to under-performer as compared to weight in Nifty and same would have held true for out-performer as well.

2. The Nifty value (end value) I am using is that of of Nifty which consists of 5 stocks which were included into the Nifty after November 2010. They being better performers would have contributed in a small measure as well.

Despite markets at all time highs, this is not a bubble as is evident from most people denying that markets are bullish as well as there being no euphoria in the retail investor arena.

Finally a couple of charts

Here is the performance (relative) of CNX Nifty vs CNX MidCap vs CNX SmallCap. See how Mid Caps and Small caps are strongly under-performing the main index

Image


Here is the same comparison between 2008 (low) and 2010 high

Image


and finally performance between 2005 (July) to 2008 peak

Image


Notice how small caps were performing prior to the peak. Comparatively, this time around we are far from any such performance. While my own thought process is that we are unlikely to see a multi year bull run from here, that would not stop Nifty from moving to 7000+ or even 8K levels before turning around.

As long as the markets are bullish, I believe one should be biased towards long rather than trying to pick the top and missing the whole rally. To me, there is only one way to approach the markets. Be long with a plan B of where one would get off if the trend starts to reverse. Prediction is Impossible and attempting that is a fools errand.

Stock of the Day – BEML

While markets are hitting new all time highs, many PSU stocks are languishing at where they were towards the close of 2008 (though as usual, there are some exceptions). BEML on the other hand is currently below even the 2008 low. This despite it having jumped more than 100% from its low of 2013. In fact, you can get BEML for the same price you could have got when it started it bull rally way back in 2003 (that is 10 years of Zero Return).

The problem with picking stocks such as BEML (or Crompton / DLF for that matter) is that unlike bullish stocks where there exists strong momentum to carry it forward (and at new highs, literally no resistance), these stocks take their own sweet time to reclaim past losses owing to selling by weak hands who want to exit the stock as soon as price nears their purchase price (of many years ago). But the risk is well worth the potential rewards it offers and hence a part of any portfolio can consist of such stocks.

Coming back to BEML, 250 seems to be a potentially strong resistance level and if taken out should lead to some solid gains as the next major resistance comes in only at 410 levels. I anticipate that PSU stocks will rise in anticipation of change in government at central level which hopefully should lead to the resumption of the old disinvestment program (as was done by NDA when it was in power). But then, thats just speculation 🙂

Image


Stock of the Day – DLF

Stocks belonging the Realty sector has been down and nearly out since the fall we saw in 2008. Of course, this has changed little on the ground where property prices continue to appreciate making it even more of a conundrum of what is ailing real estate stocks. While debt overhang remains for many, many companies which have not been troubled by Debt too have seen either flat returns (over multiple years) or worse a decline compared to its all time high.

But over the last week, some realty stocks seem to have finally found some foot hold and today saw continuation of the same (though we saw a strong decline towards the end indicating that the turnaround will not be as easy as one assumes). 

DLF had a sharp rise mid-day and while we saw a reaction towards the end of the day, the stock has still closed above a crucial resistance level of 173. As can be seen on the charts, this is a level that has been tested multiple times in the past and this augurs well for the stock. Today’s rise has not come with much volumes though which remains pretty low compared to what taking out of a major level should generally showcase. But despite all this, one needs to keep a strong eye on this stock since the next major resistance level if 75 points away from the current level.

Image  

Stock of the Day – Crompton Greaves / Siemens

Is Crompton finally out  of the woods. A company that had at one point of time shown great promise had plummeted lower on account of a continuous stream of bad results as well as questions on corporate governance. But over the last few months, the stock has been steadily rising and is now breaking multiple resistances as it surges ahead.

As can be seen on the charts, the next major resistance is nearly at 165 but once that is crossed, one can expect a stronger rise as the next major resistance is quite some distance away (nearly 40% above at 235).

Image


Another stock belonging to the same sector and which too is showing promise is Siemens. On the weekly, we can see that the stock has broken above a slanted Inverse head and shoulder neckline and should augur well for the stock in the short to medium term. Target for Inverse H&S formation comes to 940 which is a major resistance level owing to it also being the top of 2011.

Image  


An update on Nifty

Its been 9 months (nearly) since I wrote this post (link) and markets in the meantime has appreciated (with a couple of glitches on the way) by around 15%. A FD on the other hand would have yielded at best 6.75% and hence markets have for now hands down beaten my view of FD being a better bet (though since at one point we were down 8.5% from the point I wrote thus gives me some hope 😛 )
 
Before I write, a quote from the Oracle of Omaha which appeared in his recent annual Report
 
<Quote> 
Forming macro opinions or listening to the macro or market predictions of others is a waste of time.
 Indeed, it is dangerous because it may blur your vision of the facts that are truly important. (When I hear TV commentators glibly opine on what the market will do next, I am reminded of Mickey Mantle’s scathing comment: “You don’t know how easy this game is until you get into that broadcasting booth.”) 
<End Quote>
 
Of course, since Buffett has broken nearly every rule he has advocated, I am still hopeful that some day he may come around to accept that every investor and trader needs to have a  macro view (regardless of whether one wants to implement it or not) 🙂
 
Last three weeks has been hectic for the markets with Nifty gaining around 7.8%. While 7.8% in itself is not a great achievement, the fact that we have broken the all time high is leading to a lot of bullish talk (compared to say in Jan – Feb of 2012 when we logged positive gains for 7 consecutive weeks which totally gave a gain of 19%) especially since this is a news driven (Election / Modi) rally than one based on pure fundamentals.
 
That is not to say, fundamentals aren’t showing any great promise. If one were to look at the Nifty PE Ratio (Standalone), we are at the median range – neither expensive nor cheap and this indicates that any upside from here will have fundamental blessing as well (any fall with make the market cheap & hence making it even more of a Buy)
 
Since the key driver to the markets for the time being is the Elections, let me Analyse how markets behaved prior to the previous two elections (when we had some amount of euphoria).
 
NDA called for early elections in January 2004 and the results were out in May. Here is the Gains / Losses of Nifty on a monthly time frame.
 
Month Change
Jan-04 -3.9
Feb-04 -0.6
Mar-04 -2.2
Apr-04 1
May-04 -17.9
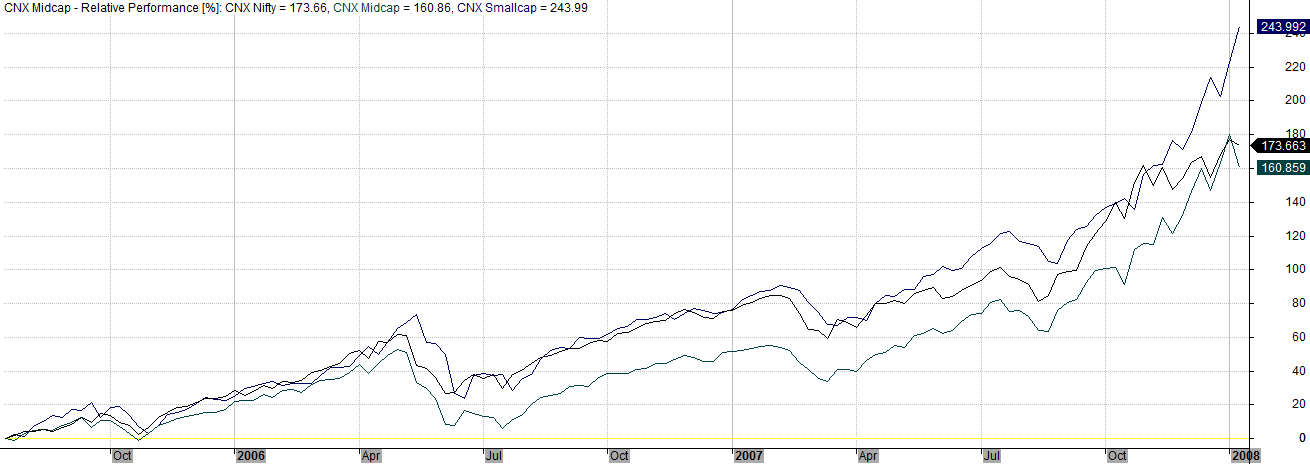
While on the face of it, it looks like the markets were slightly bearish going into the elections, one has to understand the larger context as well. Nifty after being bearish for 3 years since the Dot Com bust had recorded a rise of 73% in 2003. Hence the first few months of non performance could actually be seen as a consolidation playing out (especially since market was sure of a NDA victory). But we know how the story happened in reality.
 
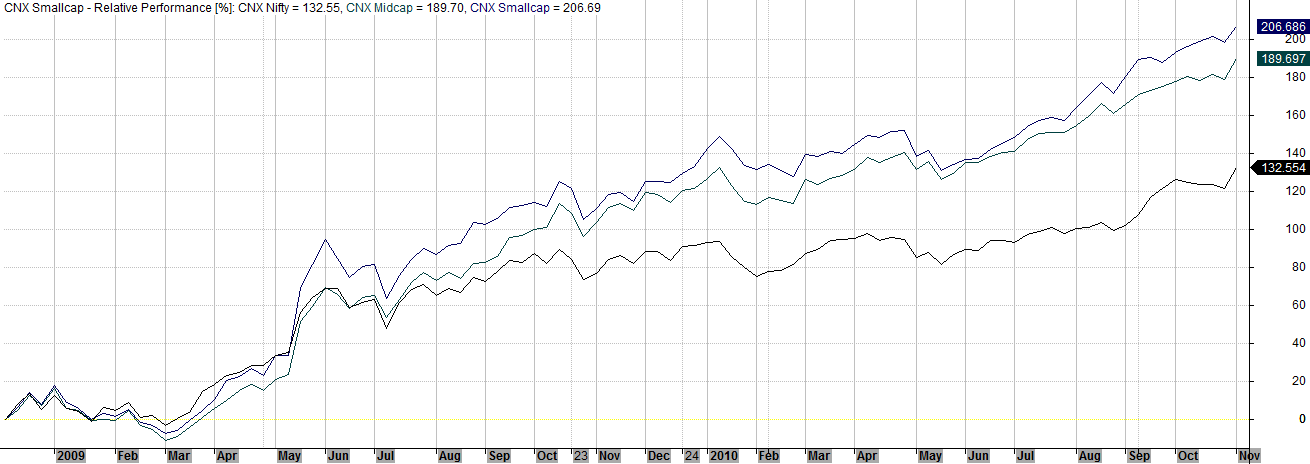
2009 was a different case altogether with the 2008 crash still being fresh and markets worldwide were already revving up. Election dates were as this time around announced in March and results came in May. Since we looked at 5 months in 2004, lets look at the same 5 months in 2009
 
Month Change
Jan-09 -2.9
Feb-09 -3.9
Mar-09 9.3
Apr-09 15
May-09 28.1
Markets worldwide bottomed out in March and started to move higher and hence our move in March and April can be attributed to that rather than election euphoria. The rise in May (where we saw markets frozen for the first time on the upper circuit) to me was more of a managed move than a move where participation was high. 
 
Coming back to the present situation. My belief (based on my reading) was that BJP (Modi) would find it difficult to come to power. The current market move though has been based on evidence that is pointing out to the contrary. Yesterday I was talking to a person who is biased towards BJP (being a party worker) and he claimed that their caclulation was that there was very high probability of NDA making it across 300. Now, I do not know how the figures have come, but its sure that UP seems to be seen as the game changer.
 
In the last decade, we had 2 major bull rallies – 2003 and 2009. One way of anticipating the next would be to see how markets had performed before the period and whether we can see a similar situation now.
 
One way of doing it would be to look at 10 year rolling returns. On the Sensex (using it instead of Nifty due to the longer amount of data we have), we can see that at end of 2002, the 10 Year rolling returns had slipped to 0.93%. At end of 2008, 92.72%. At the end of 2013, the same is 220.64%. 
 
Lets look at 5 year rolling returns. At end of 2000 (after the bust of Dot Com), the number was 1.15% while the same as of end of 2013 is 4.36% (lowest since 2001).  The average of the 10 year rolling returns comes to 380% with Standard Deviation at 285. In a way, we are below the mean, but not below or even close to 1 Standard Deviation. In 2009, we were close to 1 Standard Deviation and in 2003 we were way below that.
 
A swing projection of Nifty seems to suggest to me that the current move can extend to around 6850 at the very least, but then again, its just a projection prone to error (though it has had its good days including projecting the likely low in Aug 2013 – we came pretty close before bouncing back.)
 
While anything can happen in markets, I am still wary of a run away bull market from this point on-wards without there being a long pause in between. For now though, if you aren’t a bull, you are missing it 🙂

 As a saying goes (attributed to Keynes, but disputed). When the Facts Change, I Change My Mind. What Do You Do, Sir