CNX Realty has been one of the worst performing indices over multiple time frames since its peak in 2008 (January). While it has moved more than 18% from the low, it still trades well below 10% of its all time high.
In recent times, there has been a plethora of reports on how the sales of real estate has dropped resulting in many developers holding onto their apartment / office complexes at great cost rather than reduce the price and take a hit.
On the charts though, we seem to be seeing multiple signs of a bottom in process. As with everything else, trying to buy a beaten down sector / stock is fraught with higher risks than betting on those that are already in a good bullish phase.
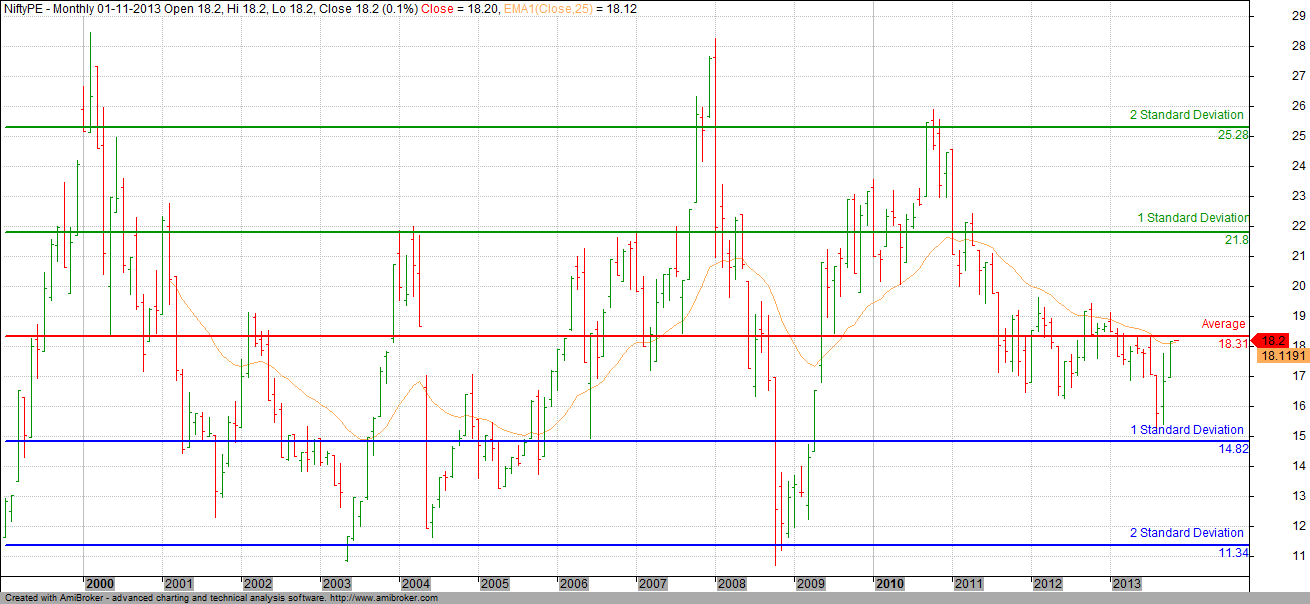
Here is the CNX Realty chart

Since CNX Realty index cannot be traded (bought into), the next best way is to trade the best stocks in that sector. Here is a Relative Strength comparison of the constituents of those stocks that form part of the CNX Realty Index

As can be seen in the chart above, the best stocks are Phoenix Industries / IB Real and Prestige. Of course, as with all things in market, there is no guarantee that these stocks will return a better risk adjusted return compared to say the worst performer – HDIL. But when betting on already weak sector, its better to be with the stronger ones than the weaker ones.