Notice: Function _load_textdomain_just_in_time was called incorrectly. Translation loading for the nimble-builder domain was triggered too early. This is usually an indicator for some code in the plugin or theme running too early. Translations should be loaded at the init action or later. Please see Debugging in WordPress for more information. (This message was added in version 6.7.0.) in /home1/portfol1/public_html/wp/wp-includes/functions.php on line 6131

Notice: Function _load_textdomain_just_in_time was called incorrectly. Translation loading for the restrict-user-access domain was triggered too early. This is usually an indicator for some code in the plugin or theme running too early. Translations should be loaded at the init action or later. Please see Debugging in WordPress for more information. (This message was added in version 6.7.0.) in /home1/portfol1/public_html/wp/wp-includes/functions.php on line 6131

Deprecated: preg_split(): Passing null to parameter #3 ($limit) of type int is deprecated in /home1/portfol1/public_html/wp/wp-content/plugins/add-meta-tags/metadata/amt_basic.php on line 118
Prashanth Krish | Portfolio Yoga - Part 53
Deprecated: Function WP_Dependencies->add_data() was called with an argument that is deprecated since version 6.9.0! IE conditional comments are ignored by all supported browsers. in /home1/portfol1/public_html/wp/wp-includes/functions.php on line 6131

Deprecated: Function WP_Dependencies->add_data() was called with an argument that is deprecated since version 6.9.0! IE conditional comments are ignored by all supported browsers. in /home1/portfol1/public_html/wp/wp-includes/functions.php on line 6131

Introducing Rel-Rand

The objective of this site is to provide proprietary and non-proprietary models portfolios that suit one’s purpose.

To begin with, introducing the Rel-Rand portfolio family. The objective of the portfolio is to beat the returns of its benchmark index by buying stocks that are showing strength and selling those that are showcasing weakness. In other words, this portfolio shall aim to hold stocks that are winning while cutting back on stocks that are losing.

The portfolio consists of 25 stocks with it being long all the time (No Shorts). Each month, on the last trading day, the system is run and stocks that have weakened over the look back period are removed and fresh ones added.

General Info
Inception Date 31-12-2010
Last Rebalance Date 31-03-2015
Rebalance Frequency Monthly
Rebalance Method Semi-Automatic
Benchmark CNX 500

Link to the PDF file containing its historical performance.

While the 5 portfolio’s each showcase different returns, since the only difference between them is the order of ranks, we believe that over time, all of them will showcase similar returns.

The file will be next updated on 30th April 2015.


Portfolio Construction – An Introduction

The long term goal of building wealth in markets starts from being able to get right a portfolio of stocks that suit ones risk tolerance. Take too much of risk and you may jump ship well before the goal is reached, take too little and your goals may remain unfulfilled.

So, what is risk?

While risk is often defined as the volatility of the investment, Warren Buffett sees Risk as Permanent loss of Capital which seems to make much more sense when taken in the context that no investment (other than Fixed Deposits) will yield a return  without some amount of volatility.

Hence when a portfolio is being build, one has to ensure that the risk of permanent loss of capital is kept low. But then we come to the axiom which seems to say that Risk and Reward go hand in hand. Higher the risk, Higher the return, or so goes the saying.

But as Howard Marks says, while its true that market appears to provide higher rewards for assets that seemingly have higher risks, its worth noting the word “appear.” We’re talking about investors’ opinions regarding future return, not facts. Risky investments are – by definition – far from certain to deliver on their promise of high returns.”

By creating a portfolio of stocks, the idea is to minimize those risks by spreading them across. But the question that comes up next is that while its true that its better to have a basket of securities, how many should one have. Should one have a few stocks which one beliefs will deliver strong returns or spread it thin across many stocks to ensure that one or two bad apples do not negatively impact the net portfolio.

Below here, I have reproduced in graphical form the damage a portfolio can see from a stock that has fallen 25% from the entry price (Equal investment is assumed in all the stocks)

Portfolio Risk


The chart above shows the damage to a portfolio in case a single stock among the portfolio constituents goes down by 25%. The impact is highest if the number of stocks in a portfolio is just 5 and the lowest in case the portfolio consists of 50 stocks.

On the other hand, we get a similar number if a stock moves up by 25%. For a portfolio with 5 stocks, the net value of the entire portfolio moves up by 5%. On the other hand, in the portfolio of 50 stocks, this barely makes a dent as the portfolio climbs a partly 0.50%.

We believe that a good portfolio can be of 20 – 25 stocks which in essence will mean that the investment in each stock is limited to 4 – 5 percent. But the choice comes down to both the risk taking capacity as well as the goals one defines.

There is a large amount of reading material that is available on the internet that goes into every little facet concerning portfolio management and construction and it can help one a lot.

In our future posts, we shall attempt to build portfolios using various proven methodologies. But for now, lets wrap it up with a nice little presentation from Vanguard (Link)

A new year, a new start

The Bombay Stock Exchange is the oldest stock exchange in Asia with it being established in 1875 but when it comes to Sensex, its just 29 years old. While trading in exchanges situated in United States were still trading using the pit, we moved to computerized trading. Even today, Initial Public Offers in United States is pretty opaque with only the chosen few getting hold of the shares before it gets listed on the exchanges, our here we have democratized it so deeply that everyone has a equal chance at allotment.

But when it comes to Financial Education and Research, we are far behind the rest of the pack. On one hand, we have one of the largest number of listed companies and on the other, the percentage of folks who invest in the markets both directly and in-directly is pretty minuscule.

While investing in stock markets is seen as similar to gambling on the race track, investing in Gold and Insurance is seen as Investment that can fetch good returns on the long run even though evidence to support that view is lacking.

Our financial universe is filled with intermediaries who are willing to sell you dreams of getting rich without having to bother either with the barest minimum of understanding, all for a small fee of course.

The basic objective of this site is to provide a way to construct portfolios based on your ideologies / your risk taking abilities as well as your requirements without having to pay an arm and a leg for that pleasure.

While we are strong believers in the John Bogle method of investing, we also believe that its very much possible to generate above market returns. This site will aim to research into methods and tools that can make it possible for the common investor.

Having said all that, do note that we are not registered Investment advisor and our posts are not a recommendation or solicitation to buy or sell any security or as investment advice. All contents of the website are provided for information and educational purposes only.

So, without much ado, Welcome aboard 🙂

Investing in Markets – Ways and Means

We have hundreds if not more number of studies that has shown that over the long term, the best growth is delivered only by equities. While in India, Real Estate has also proven to be a bonafide wealth generator, I strongly believe that growth over the next decade or two will more likely come in Equity with Real Estate more or less providing sub-optimal returns.

So, how does one go about in investing into the markets. For a lay man, there lies there options of investing his savings into the markets

1. Investing via a Mutual Fund

Theoretically speaking, this is the easiest way to gain exposure to the markets. But then again, not all Mutual Funds are the same and hence some amount of research is necessary to ensure that we invest in the funds that have showcased long term growth vs chasing funds that have made a mark in the very near past.

While most mutual funds in United States haven’t been able to beat the benchmark consistently, in India, we have hordes of fund managers who have beaten the benchmark returns year after year. Whether this is due to they being Genuis or whether its because of the fact that the benchmarks are not really that good a criteria to compare against is a story for another time.

But having said that, its a fact that top funds keep changing over time. Prashant Jain is a much acclaimed fund manager, but lets face the facts – his top fund, HDFC Top 200 has generated a CAGR return of 13.36% DSP BlackRock Micro Cap Fund which over the same period has seen a CAGR return of 24.5%.

What I have done above is known as Selection bias. I have selected the DSP fund not by foresight but by using  current returns. In 2008 and 2009, the best large cap fund (5 year returns) was Reliance Growth Fund. Over the last 5 years, this fund has provided a CAGR return of 12.8%.

Over a similar period Nifty Total Return Index has shown a CAGR growth of 11.68%. While one can still argue about there being a alpha out there in funds such as HDFC Top 200 and Reliance Growth, we need to also consider the fact that they hold stocks outside of Nifty constituents and in essence, comparing the performance to Nifty is erroneous.

Personally my family is invested into multiple funds across the spectrum and overall, returns have been decent enough. As Warren Buffet once said, diversification is the only free lunch and this applies to Mutual funds as well.

A step above Mutual Funds comes a more personalized investment vehicle.

Portfolio Management Scheme (PMS for short):

Those who follow me on Twitter know that I am a very strong skeptic of PMS as a investment vehicle. My main objection comes from the fact that for most brokerage led PMS, this is not something where the objective is to generate above market returns for the client but is a nice way to churn the portfolio as much as possible in an attempt to garner as much brokerage as can be culled from the account.

In fact, it is a surprise that Assets under Management of PMS has growth substantially over the years despite most of them not even providing decent returns (let alone market beating) and worse of all, hiding the facts from the potential investors.

AUM

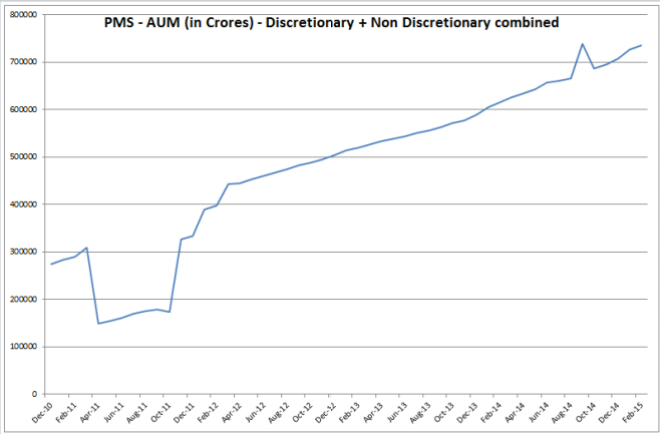
I do not have the break-down as which firm manages what amount, but just as a simple exercise, lets review the performances of top names in this business

Coming up first would be Sharekhan (Link)

AUM: Around 32 Crores

Sharekhan

What surprises me is not the under-performance but the fact that NSE Nifty returns are shown as having given different returns when compared with different products.

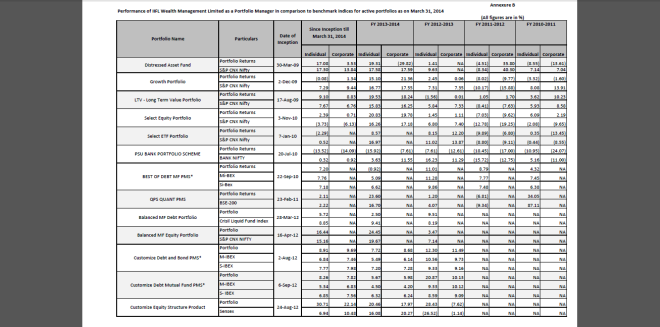
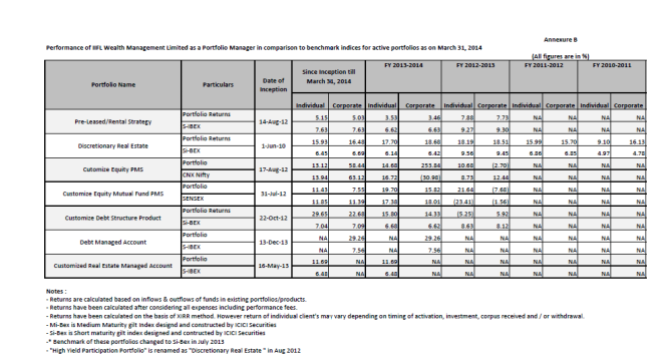
India Infoline (Link)

AUM: 4600 Crores

India Infoline runs a multitude of funds

IIFL-1

IIFL-2

Motilal Oswal (Link)

AUM: 1400 Crores

Moti

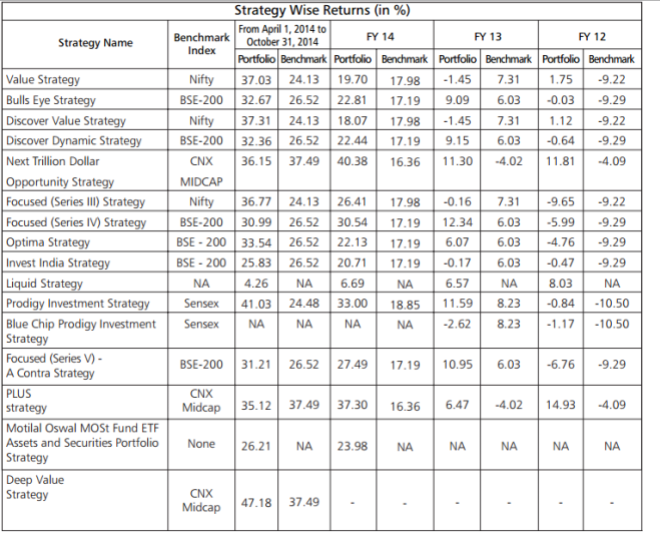
One of the few which has beaten their benchmarks. But then again, these are 1. Weighted Returns (and not everyone would get the same) and 2. Am not sure if these are after fees or before fees (Fees are substantial in nature, refer to page 14 of the document).

There are at least another 25 – 30 firms offering PMS, but I do hope you get the idea. PMS is not a ideal vehicle to ride the markets. In fact, one PMS firm actually managed to lose money when the markets were going up and lost money when the markets were coming down. The fund manager is now a star investment advisor 🙂

Last but not the least

Direct Investments into Equity:

Directly investing into equities is one of the most risky ways to put savings to work if you are neither willing to work hard nor have a clue about how markets work. Too many folks have burnt their hands in equity investing to swear off anything related to equity (Direct or not). But having said that, the only way to beat the returns generated elsewhere can be found here.

But if you are willing to put in the hours required to learn and understand the various way to analyze the markets, its a effort that can provide for worthwhile returns with total control in your hand.

But a caveat first – International evidence has shown that the average equity investor under-performs the markets very badly. In fact, many would have been better off just putting the cash under their pillow than investing into markets

InvestorReturns

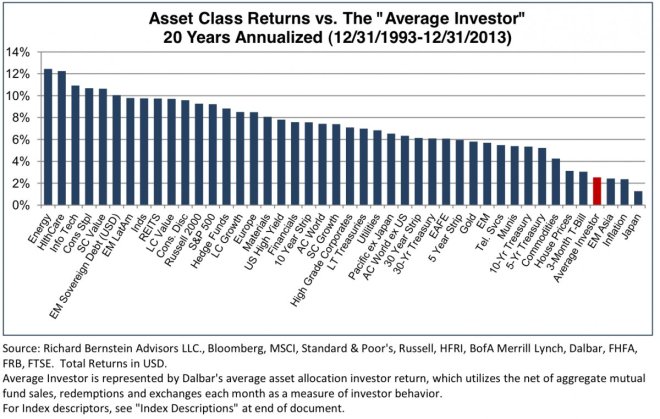
While the above data comes from Mutual Fund investments and redemption by individual investors, with human psyche being the same, direct returns by investors would not be too different.

Investing (no matter how large or small your investments is) is a full time endeavor. Unless you are willing to devote a substantial amount of time, this is definitely not a area to dabble in since not only would the returns be below par, but the time spent could have been better utilized elsewhere.

To fill this gap, we have many a person offering to advise (Newsletter based generally) for a small fee. But with the vast majority of them being pure snake oil sellers, I would generally avoid all such stuff unless they have proof of their pudding (Audited returns of their own funds which in turn should be substantial portion of their net worth)

To conclude, while its true that some funds have shown ability to beat the markets, I recommend novice investors to distribute between a few select funds and a few ETF’s that track the index (Index funds). Invest regularly and you would turn out fine regardless of the gyrations we see in markets.

Of Helmets & Stop Losses

Bangalore (like many other cities) has had a rule for compulsory wearing of helmets by those riding a two wheeler. But what I observe is that many a helmet are worn to protect not the head but the risk of getting caught by the police constable. At the first instance of a risk to the head, the helmet would be sure to bail itself out leaving the head to take care of the mess by itself. And since the wearer of the helmet in a way thinks that his head is protected, he may actually take more risks than what he would have when he was not wearing one (before it was made compulsory).

So, what is the relationship between the helmet and the stop loss you may ask. Well, there is one. A wrong stop loss like a wrong helmet may cause more grief to the user than to a trader who trades without one.

A stop loss is said to protect one from the loss while allowing the winners to remain in the system. But the thing about stops is that if not placed right, it has a ability to cause more damage than one where it was not used in the first instance.

So, what is the ideal stop you may wonder. Is placing a stop above a resistance / below a support a good idea? Or should one just stick to one’s risk profile and say that if a stock loses more than X% of my capital, I am out?

With the increase in algorithmic trading, stops below support / resistance are the easiest to take out since everyone sees more or less the same chart and comes more or less to the the same conclusions.

As to those using X% of risk per trade, the problem comes by the way of the fact that the stock may not necessarily fit that profile. Some stocks have very high volatility while some remain bland for most of the time but then spurt up in one swing what would be a multi X deviation from the mean.

So, when is that one should sell or buy (based on one’s existing long or short position). To me, the best way is the way described by Jesse Livermore (which I shall paraphrase) where he says that if a stock is good enough to sell, it should be good enough to short as well. So, if you are placing a stop at level X, not only should you be happy to sell your longs there, but also be willing to go short.

That does not mean that one has to go short every time one wants to exit a long, but its the conviction that matters.

On the other hand, if you are using a portfolio / ranking based model, the above assumption may not be required since you will be exiting one stock in favor of other which your model is showcasing as one with a better opportunity.

How often does the Sensex double

Recently when Sensex breached (for a few moments) the 30000 mark on Sensex, Anchors on CNBC-TV18 dressed up with T-Shirts with 30000 printed in bold numbers (and in Red for added effect).

Way back in 2007, with Sensex breaching one round number after another, it was a series of parties in the studios of business channels. But I wonder if television anchors celebrated when Sensex crossed above the 25600 mark.

Whats so important you may ask about the 25.6K mark. Well, it signified the 8th instance of Sensex doubling in price. Below is the table as to when we crossed the mark and how many days it took to achieve it.

The fastest double for the Sensex came in 1990 when it doubled in just 188 days (all calculations are on calendar days and not trading days). The slowest on the other hand took all of 4656 days (translating into 12.75 years).

Average time taken by Sensex to double is around 4.5 years. 51200 is the next double number & I do wonder if we shall scale that peak by 2020

Sensex

Comparing PE Ratio of Sensex & Nifty

For a long time, we looked at only one Index when it came to the Indian Markets and that was the Sensex. Even years after Nifty had come into the picture, Sensex reigned supreme. While Bombay Stock Exchange is the oldest exchange in Asia, when it came to the Sensex, the whole concept is fairly recent  having been first compiled in 1986, more than 110 years after it was founded.

But with derivative trading in Nifty taking precedence, Nifty is the key Index most participants look at. While we have seen Sensex too becoming available for trade, the first mover advantage has meant that Nifty has virtually steam rolled over it.

When it comes to analyzing how expensive or cheap the markets have been, I have most of the time stuck to Nifty since NSE has made the download free and easy. But today I decided to update my Sensex PE and the variation was very interesting to say the least.

First out, here is the updated Nifty Price Earnings (trailing 4 Quarters, Standalone) chart with long term average and standard deviations

Nifty

NSE provides data from 1999 and the calculation suggests that we are closing on to the peak valuation of 2010.

Theoretically speaking, the Sensex PE should show a similar number despite the fact that it has lower number of stocks compared to Nifty. But Sensex Price Earnings number seems to suggest that the market is not all that expensive. A caveat here, While I downloaded the Sensex Price Earnings number from its website, I could not gather as to whether the same is based on Consolidated numbers or Standalone and that in itself can make a difference.

Sensex

What is interesting is that sector weights aren’t too different from each other. Below is the sector weight charts for both Nifty and Sensex.

Nifty Sensex

As you can see, the difference in weights is not so much as to impact the net valuation on a big time.

To better understand the moves of Sensex PE Ratio and Nifty PE Ratio, here is the chart of them combined (Relative Comparison)

Nifty

One of the things that is straight away visible is that while they have more or less moved in sync in the past, this time around, Nifty PE Ratio has shot up more substantially than that of Sensex.

And here is a Relative Comparison chart of Nifty & Sensex

Nifyt

And finally, a ratio chart where I divide Sensex with CNX Nifty

Nifty

What the above chart shows is the points Sensex moves for every point on Nifty. Since 2001, this has been in a broad range.

Personally, I would stick with the NSE Price Earnings Ratio but it would be interesting to know why we are seeing this sudden difference in the Price Earnings of Sensex vs Nifty. The difference lies in a few company results, but it would be interesting to know which of them have actually caused this action.